
Electromagnetism
Science: Physics: Electrostatics
9-12
45 Minutes
1.7
- pen or pencil
- blank sheet of paper
Activity by Peter Fox
Lessons
TNS
Electromagnetism
Activity Overview
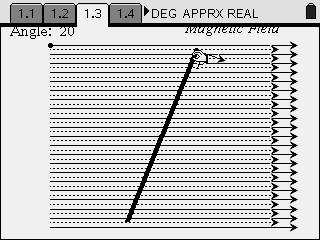
Students use an animated diagram of a magnetic field and a coil. Students rotate the coil and determine the number of magnetic field lines passing through the coil at a given angle. Students graph the relationship and then consider the rate of change of the magnetic field.
Download Files
Teacher Files
Student Files
Science: Physics: Electrostatics
9-12
45 Minutes
1.7
- pen or pencil
- blank sheet of paper
Activity by Peter Fox
Lessons
TNS
iPad is a trademark of Apple Inc., registered in the U.S. and other countries.
Vernier EasyData,Vernier EasyLink and Vernier EasyTemp are registered trademarks of Vernier Science Education.
Vernier EasyData,Vernier EasyLink and Vernier EasyTemp are registered trademarks of Vernier Science Education.