
Folding Parabolas
Math: Algebra I: Quadratic Functions
9-12
20 Minutes
TI-Nspire™ CX series
TI-Nspire™ CX CAS/CX II CAS
3.2
Lessons
TNS
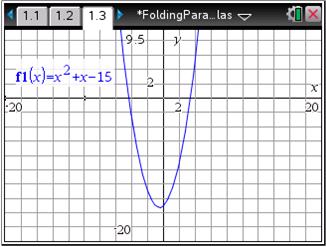
Folding Parabolas
Activity Overview
In this activity, students graph a quadratic function and investigate its symmetry by choosing pairs of points with the same y-value. They then calculate the average of the x-values of these points and discover that not only do all the points have the same x-value, but the average is equal to the x-value of the vertex.
Download Files
Teacher Files
Student Files
Math: Algebra I: Quadratic Functions
9-12
20 Minutes
TI-Nspire™ CX series
TI-Nspire™ CX CAS/CX II CAS
3.2
Lessons
TNS
iPad is a trademark of Apple Inc., registered in the U.S. and other countries.
Vernier EasyData,Vernier EasyLink and Vernier EasyTemp are registered trademarks of Vernier Science Education.
Vernier EasyData,Vernier EasyLink and Vernier EasyTemp are registered trademarks of Vernier Science Education.