
Trend or Noise?
Math: Statistics: Sampling and Experimentation
9-12
45 Minutes
TI-Nspire™ CX series
TI-Nspire™ CX CAS/CX II CAS
3.0
Lessons
TNS
Trend or Noise?
Activity Overview
This lesson involves investigating aspects of statistical information reported in the media or other venues, aspects that are often misunderstood by those unfamiliar with sampling.
Objectives
- Students will recognize that samples from a population typically have smaller variability than the population.
- Students will recognize that many reported patterns are really nothing but random noise and not patterns at all.
- Students will recognize that small samples might have more variability than large samples.
Vocabulary
- distribution
- boxplots
- interquartile range (IQR)
- mean
- median
- sample
About the Lesson
This lesson involves investigating aspects of statistical information reported in the media or other venues, aspects that are often misunderstood by those unfamiliar with sampling.
As a result, students will:
- Look at a randomly-generated distribution of student achievement scores for a whole grade and for the individual classes in that grade
- Analyze boxplots of the data and observe the variation among the classes, identifying a class that seems to have higher scores.
- Analyze the distribution of the mean scores for each class in the grade and relate it to the distribution of the scores for the entire grade.
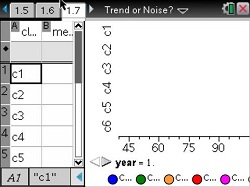
- Choose one of the teachers' classes and examine the scores for that teacher across consecutive years, looking for trends or seemingly large changes.
Download Files
Math: Statistics: Sampling and Experimentation
9-12
45 Minutes
TI-Nspire™ CX series
TI-Nspire™ CX CAS/CX II CAS
3.0
Lessons
TNS
iPad is a trademark of Apple Inc., registered in the U.S. and other countries.
Vernier EasyData,Vernier EasyLink and Vernier EasyTemp are registered trademarks of Vernier Science Education.
Vernier EasyData,Vernier EasyLink and Vernier EasyTemp are registered trademarks of Vernier Science Education.