
Tossing Coins
Math: Statistics: Probability and Random Variables
9-12
45 Minutes
TI-Nspire™ CX series
TI-Nspire™ CX CAS/CX II CAS
3.9
Lessons
TNS
Tossing Coins
Activity Overview
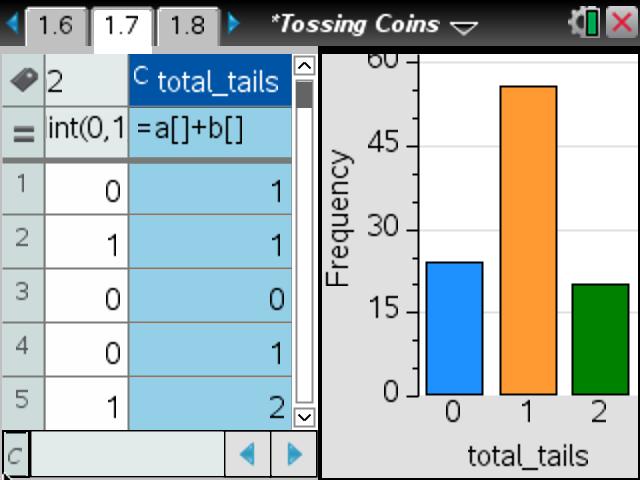
In this activity, students will use a simulation to find the experimental probability of independent events, tossing two coins. They will find the sample space and then compare the experimental and theoretical probabilities.
Download Files
Teacher Files
Student Files
Math: Statistics: Probability and Random Variables
9-12
45 Minutes
TI-Nspire™ CX series
TI-Nspire™ CX CAS/CX II CAS
3.9
Lessons
TNS
iPad is a trademark of Apple Inc., registered in the U.S. and other countries.
Vernier EasyData,Vernier EasyLink and Vernier EasyTemp are registered trademarks of Vernier Science Education.
Vernier EasyData,Vernier EasyLink and Vernier EasyTemp are registered trademarks of Vernier Science Education.