
Modeling Median Incomes
9-12
Modeling Median Incomes
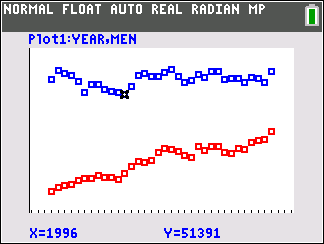
In this TI-84 family activity, students investigate and examine the data underlying the claim that women’s income is catching up to men’s income.
Students will be able to:
- Model a contextual situation mathematically and use the model to make a prediction
- Represent two quantitative variables on a scatter plot, and describe how the variables are related.
- Find and interpret linear equations to model relationships between two quantitative variables;
- Use proportional relationships to solve real-world and mathematical problems
Statements often occur in the media making claims about trends or issues/problems that are (or should be) of general interest. This activity follows up one such statement by finding and examining the data underlying the claim that women’s income is catching up to men’s income. The bigger picture has many elements that are ignored in this investigation, but could be followed up in later investigations (the nature of the jobs, when women work as opposed to having children, the level of education required for a job, etc.).
The activity can be used with middle grades students familiar with percentages and ratios, possibly as an end of unit investigation. The students should be familiar with using tables or scatterplots to identify trends and patterns. Students in grades 8 and above might plot the data and fit some kind of model (by hand or least squares regression) depending on their mathematical background.
9-12
Vernier EasyData,Vernier EasyLink and Vernier EasyTemp are registered trademarks of Vernier Science Education.