
Finding a Line of Best Fit
Math: Algebra I: Statistics
9-12
35 Minutes
TI-84 series
Lessons
Finding a Line of Best Fit
Activity Overview
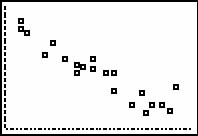
Students make a scatter plot of heart rate versus age data and draw lines of best fit using three different methods - by hand, using the upper and lower quartiles, and using the handheld's regression feature.
Download Files
Teacher Files
Student Files
Math: Algebra I: Statistics
9-12
35 Minutes
TI-84 series
Lessons
iPad is a trademark of Apple Inc., registered in the U.S. and other countries.
Vernier EasyData,Vernier EasyLink and Vernier EasyTemp are registered trademarks of Vernier Science Education.
Vernier EasyData,Vernier EasyLink and Vernier EasyTemp are registered trademarks of Vernier Science Education.