Find answers to the top 10 questions parents ask about TI graphing calculators.
Learn about the math and science behind what students are into, from art to fashion and more.
Discover new ways to help students succeed in math, science and STEM using TI technology.
Get hundreds of video lessons that show how to graph parent functions and transformations.
Texas Instruments
9-12
20 Minutes
TI-Nspire™TI-Nspire™ CAS
3.0
In this activity, students will explore extrema, zeros, and other key values of quadratic functions in real-world contexts.
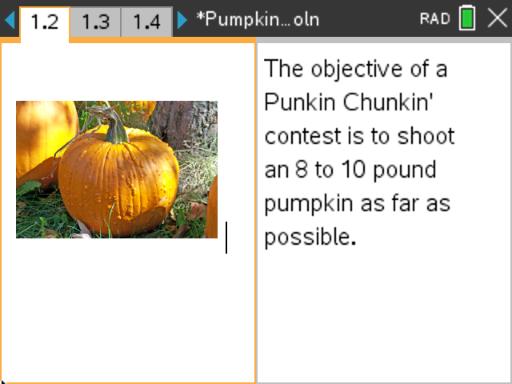
In Extreme Punkin' Chunkin’, students explore quadratic function graphs to identify extrema, zeros, and other key values of quadratic functions in real-world contexts. In the first two problems, students explore equations that model the launching of pumpkins from a medieval device called a trebuchet, which converts potential energy into kinetic energy.
After graphing the model functions, students will use the Graph Trace tool to find the zeros, minimum or maximum and y-intercept. Throughout the activity, students provide responses to a variety of questions to assist them in developing understanding of the relevant patterns and skills.
In addition to the Punkin Chunkin’ problems, students explore other problems involving profit maximization for an espresso stand and cost minimization for a company producing kayaks.
In each of these problems, students will use the same method as Problem 1, using the Graph Trace tool, to find the values of interest. Teacher discussion can include how to find these values algebraically.
TI websites use cookies to optimize site functionality and improve your experience. To find out more or to change your preferences, see our cookie policy page. Click Agree and Proceed to accept cookies and enter the site.
You can control your preferences for how we use cookies to collect and use information while you're on TI websites by adjusting the status of these categories.