
Percentiles & Z-Scores
Math: Statistics: Normal Distributions
9-12
45 Minutes
TI-84 series
Lessons
Percentiles & Z-Scores
Activity Overview
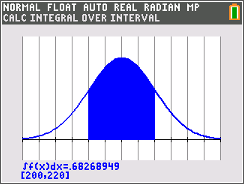
Students calculate percentiles, z-scores, and probabilities using normal distributions.
Download Files
Teacher Files
Student Files
Math: Statistics: Normal Distributions
9-12
45 Minutes
TI-84 series
Lessons
iPad is a trademark of Apple Inc., registered in the U.S. and other countries.
Vernier EasyData,Vernier EasyLink and Vernier EasyTemp are registered trademarks of Vernier Science Education.
Vernier EasyData,Vernier EasyLink and Vernier EasyTemp are registered trademarks of Vernier Science Education.