
How Fast Are You?
Science: Biology: Human Body
Science: Life Science: Human Body
9-12
6-8
6-8
20-30 Minutes
TI Connect™ CE
TI-84 series
Lessons
How Fast Are You?
Activity Overview
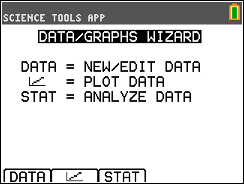
Use the Data/Graphs Wizard tool in the SciTools App to compare the averages of four sets of data.
Download Files
Lesson Files
Science: Biology: Human Body
Science: Life Science: Human Body
9-12
6-8
6-8
20-30 Minutes
TI Connect™ CE
TI-84 series
Lessons
iPad is a trademark of Apple Inc., registered in the U.S. and other countries.
Vernier EasyData,Vernier EasyLink and Vernier EasyTemp are registered trademarks of Vernier Science Education.
Vernier EasyData,Vernier EasyLink and Vernier EasyTemp are registered trademarks of Vernier Science Education.