
Geometric Distributions
Math: Statistics: Normal Distributions
Math: Statistics: Probability and Random Variables
9-12
45 Minutes
TI-84 series
Lessons
Geometric Distributions
Activity Overview
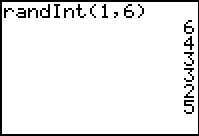
Students simulate a geometric distribution of rolling a die to determine experimental probabilities and calculate theoretical probabilities.
Download Files
Teacher Files
Student Files
Math: Statistics: Normal Distributions
Math: Statistics: Probability and Random Variables
9-12
45 Minutes
TI-84 series
Lessons
iPad is a trademark of Apple Inc., registered in the U.S. and other countries.
Vernier EasyData,Vernier EasyLink and Vernier EasyTemp are registered trademarks of Vernier Science Education.
Vernier EasyData,Vernier EasyLink and Vernier EasyTemp are registered trademarks of Vernier Science Education.