
Quadratic Regression with Transformation Graphing
Math: Algebra II: Quadratics
9-12
50 Minutes
TI Connect™
TI Connect™ CE
TI Connect™ CE
TI-84 series
Visit TI Math.com.
Lessons
Quadratic Regression with Transformation Graphing
Activity Overview
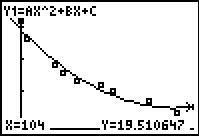
Students will enter data into lists and graph scatter plots and perform a multiple regression on the plots. They will also make predictions or draw conclusions from the quadratic model.
Math: Algebra II: Quadratics
9-12
50 Minutes
TI Connect™
TI Connect™ CE
TI Connect™ CE
TI-84 series
Visit TI Math.com.
Lessons
iPad is a trademark of Apple Inc., registered in the U.S. and other countries.
Vernier EasyData,Vernier EasyLink and Vernier EasyTemp are registered trademarks of Vernier Science Education.
Vernier EasyData,Vernier EasyLink and Vernier EasyTemp are registered trademarks of Vernier Science Education.