
Real Graphs
Math: Middle Grades Math: Functions
6-8
45 Minutes
TI-Nspire™ CX series
TI-Nspire™ CX CAS/CX II CAS
TI-Nspire™ Apps for iPad®
3.6
Lessons
TNS
Real Graphs
Activity Overview
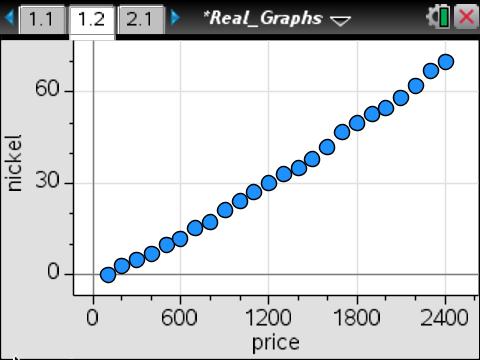
This lesson involves identifying patterns of data from given lists.
Objectives
- Students will explore the plots of various data sets, looking for patterns.
- Students will identify plots that appear to be functions.
- Students will determine which plots appear to form a linear pattern, and then acquire the best function that models the pattern, in the form of y = mx + b.
- Students will parse the linear function, looking at the slope and the y-intercept in the context of the data that was used. They will identify the units of these values and their contextual meaning.
- Students will use functions to model relationships between quantities.
Vocabulary
- function
- model
- y-intercept
- slope
- table
- linear function
- variables
- independent variable
- dependent variable
- set
About the Lesson
This lesson involves identifying patterns of data from given lists.
As a result, students will:
- Identify patterns that might represent functions, and in particular, linear functions.
- Represent realistic relationships.
- Identify the best function to fit the data and examine its parts in context.
Download Files
Math: Middle Grades Math: Functions
6-8
45 Minutes
TI-Nspire™ CX series
TI-Nspire™ CX CAS/CX II CAS
TI-Nspire™ Apps for iPad®
3.6
Lessons
TNS
iPad is a trademark of Apple Inc., registered in the U.S. and other countries.
Vernier EasyData,Vernier EasyLink and Vernier EasyTemp are registered trademarks of Vernier Science Education.
Vernier EasyData,Vernier EasyLink and Vernier EasyTemp are registered trademarks of Vernier Science Education.