
Please Re-Leaf Me
Science: Biology: Plants
9-12
80 Minutes
TI-84 series
This is Activity 4 from the EXPLORATIONS Book: Biology with the TI-83 Plus.
Lessons
Please Re-Leaf Me
Activity Overview
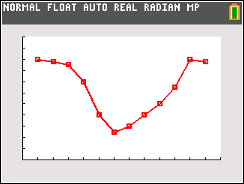
In this activity, students examine data of carbon dioxide output in a forest. They graph the data and understand seasonal flucuations of carbon dioxide output. They make predictions about carbon dioxide output in other biomes.
Download Files
Lesson Files
Science: Biology: Plants
9-12
80 Minutes
TI-84 series
This is Activity 4 from the EXPLORATIONS Book: Biology with the TI-83 Plus.
Lessons
iPad is a trademark of Apple Inc., registered in the U.S. and other countries.
Vernier EasyData,Vernier EasyLink and Vernier EasyTemp are registered trademarks of Vernier Science Education.
Vernier EasyData,Vernier EasyLink and Vernier EasyTemp are registered trademarks of Vernier Science Education.