
Probability Distributions
Probability Distributions
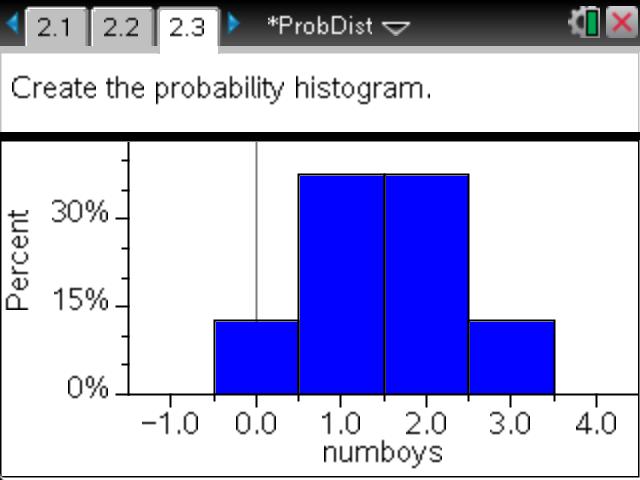
Students list outcomes for probability experiments such as flipping a coin, rolling number cubes, and observing the sex of each child born in a family. They use these outcomes to record the values of random variables, such as number of tails, sum of the cubes, and number of boys. Students then create the histograms representing the distributions of the variable and complete a table listing the probabilities of each value.
Download the attached PDF and look over the information on the first page. Download and distribute the attached .tns file and Student Worksheet for use during the activity. A .tns file containing expected student results is also available for download.
Discuss the material from the activity pages and worksheet with students as needed.
Encourage students to summarize what they have learned from completing the activity. If desired, discuss the extension with students.
Before the Activity Files
After the Activity Files
Vernier EasyData,Vernier EasyLink and Vernier EasyTemp are registered trademarks of Vernier Science Education.