Analyzing Country Data

6-8
Analyzing Country Data
In this activity, students will examine sample ages from three countries displayed in a spreadsheet and in relative frequency histograms that highlight the distinctive features of the distribution of the ages from each sample.
- Students will determine and interpret percents to summarize data.
- Students will interpret medians and quartiles to summarize sample data. Use measures of center and measures of variability to draw informal comparative inferences about two populations.
- Students will compare and contrast different sample data summarized by box plots and histograms. They will assess the degree of visual overlap of two numerical data distributions.
- Students will construct viable arguments and critique the reasoning of others.
- Students will use appropriate tools strategically.
- boxplot
- dot plot
- histogram
- median
- population
- quartiles
- sample
This activity involves sample listings of the ages of 200 people from each of three countries: USA, Kenya, and Japan.
Students will:
- Consider why a summary of ages is important and how a summary of the ages can be connected to a better understanding of the populations of each country.
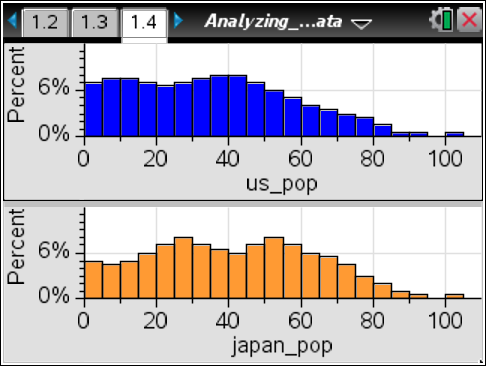
- Examine sample ages from the three countries displayed in a spreadsheet and in histograms with percent on the vertical scale that highlight the distinctive features of the distribution of the ages from each sample.
- Connect descriptions of the histograms to summaries based on box plots.
- Learn that samples are not exact pictures of the population but sample statistics can provide a reasonable way to develop estimates of the total populations of each country.
- As an extension, students create a sample of their “own” country and put together a summary of the country based on the sample.
6-8
Vernier EasyData,Vernier EasyLink and Vernier EasyTemp are registered trademarks of Vernier Science Education.

