
Light and Waves
Science: Physics: Sound and Waves
Science: Physics: Light and Optics
9-12
45 Minutes
1.7
- pen or pencil
- blank sheet of paper
Activity by Peter Fox
Lessons
TNS
Light and Waves
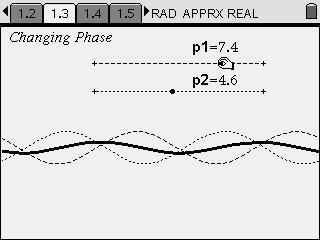
Activity Overview
Students explore the interference patterns of waves formed by two point sources. Students are able to collect data and draw conclusions about the nodal lines formed by the interference.
Download Files
Teacher Files
Student Files
Science: Physics: Sound and Waves
Science: Physics: Light and Optics
9-12
45 Minutes
1.7
- pen or pencil
- blank sheet of paper
Activity by Peter Fox
Lessons
TNS
iPad is a trademark of Apple Inc., registered in the U.S. and other countries.
Vernier EasyData,Vernier EasyLink and Vernier EasyTemp are registered trademarks of Vernier Science Education.
Vernier EasyData,Vernier EasyLink and Vernier EasyTemp are registered trademarks of Vernier Science Education.