
Predicting Metabolic Rates of Astronauts
Math: Statistics: Data Analysis
Math: Statistics: Probability and Random Variables
9-12
45
TI-Nspire™ CX series
TI-Nspire™ CX CAS/CX II CAS
3.2
Lessons
TNS
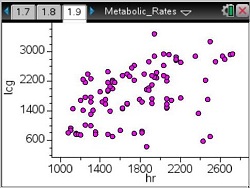
Predicting Metabolic Rates of Astronauts
Activity Overview
In this lesson, students will visually estimate correlation.
Objectives
In this lesson, students will:
- visually estimate correlations
- adjust weight in a weighted average to visually determine a curve of best fit for estimating metabolic rates
- find the sum of the squares of the difference between student estimates and NASA estimates of metabolic rates
- use the sums of squares to determine which students' estimates are closest to NASA's estimates
Download Files
Math: Statistics: Data Analysis
Math: Statistics: Probability and Random Variables
9-12
45
TI-Nspire™ CX series
TI-Nspire™ CX CAS/CX II CAS
3.2
Lessons
TNS
iPad is a trademark of Apple Inc., registered in the U.S. and other countries.
Vernier EasyData,Vernier EasyLink and Vernier EasyTemp are registered trademarks of Vernier Science Education.
Vernier EasyData,Vernier EasyLink and Vernier EasyTemp are registered trademarks of Vernier Science Education.