In this lesson you will examine a rational fraction with a nonlinear asymptote. Using propFrac( will be helpful in determining the equation of the nonlinear asymptote.
5.4.1 Use your TI-89 to rewrite the rational function
![]() as a polynomial plus a proper fraction.
as a polynomial plus a proper fraction.
Click here for the answer.
5.4.2 What do the parts of the proper fraction tell you about the graph of
![]() ? Click here for the answer.
? Click here for the answer.
Provide graphical support for the answer to Question 5.4.2 by graphing the function in a large window and in a window near x = 2.
The Wide View
-
Enter
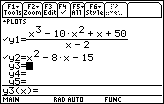
 into y1 and y = x2 – 8x – 15 into y2.
- Set the Window values to [-50, 50] x [-2500, 2500] with xscl = 10 and yscl = 500.


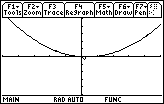
The graph of
![]() looks like the graph of the parabola y = x2 – 8x – 15 in this large viewing window.
looks like the graph of the parabola y = x2 – 8x – 15 in this large viewing window.
The Narrow View
-
Replace y2 with the function

- Set the Window values to [0, 4] x [-500, 500] with xscl = 1 and yscl = 50

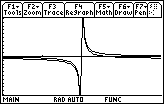
The graph of
![]() looks like the graph of
looks like the graph of
![]() in this window.
in this window.
A Medium View
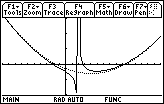
To show both the vertical and parabolic asymptotic behavior of
![]()
- Delete y2 in the Y= Editor
-
Graph
 with line style
-
Graph y2 = x2 – 8x – 15 with dot style. First enter y2 = x^2 - 8x - 15. Then place the cursor anywhere in y2 and press

 . Finally press
 .
.

- Set the Window values to [-10, 15] x [-100, 150], xscl = 1, yscl = 50
As you have seen, the choice of viewing window can dramatically affect the appearance of a function, and different windows should be used to illustrate different features. The best graph is one in which all significant features of a function are displayed or implied. Such a graph is called a complete graph. Two or more windows are often needed to illustrate a complete graph.