In lesson 5.1 you found the vertical asymptote of the rational function
![]() by looking at its graph, using tables, and by evaluating limits. The asymptote x = 3 corresponds to one of the zeros of the denominator. In this lesson you will investigate when a function has a hole in its graph.
by looking at its graph, using tables, and by evaluating limits. The asymptote x = 3 corresponds to one of the zeros of the denominator. In this lesson you will investigate when a function has a hole in its graph.
Finding Asymptote Candidates
A list of candidates for the vertical asymptotes of a rational function may be found by finding the zeros of the denominator of the function.
-
Display the Algebra menu by pressing

-
Paste the zeros( command to the Edit Line by pressing

- Complete the command to find the zeros of the denominator by entering zeros(x^2-x-6,x)
-
Display the result by pressing

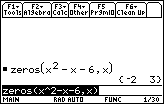
One of the zeros corresponds to the vertical asymptote x = 3. However, there is no asymptote at
Holes vs Asymptotes
When x = -2, the function is undefined but the limit of the function as x approaches -2 from the left and from the right is a single specific value. Therefore, there is a hole in the graph, and x = -2 is not a vertical asymptote.
The zero -2 is the x-coordinate of a hole in the graph. The y-coordinate of the hole can be determined by evaluating the limit of the function as x approaches -2.
5.2.1 Evaluate
![]() and discuss why x = -2 is not a vertical asymptote. Click here for the answer.
and discuss why x = -2 is not a vertical asymptote. Click here for the answer.
Displaying the Hole
In lesson 5.1 you graphed the function
![]() in a [-20, 20] x [-10, 10] window.
in a [-20, 20] x [-10, 10] window.
- Display the graph again on your calculator
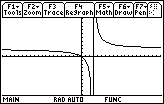
There is no apparent hole shown in this window, but if you change the viewing window, the hole may be seen.
-
Display the Zoom menu by pressing

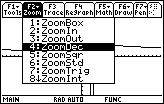
- Select 4:ZoomDec to change to a decimal window
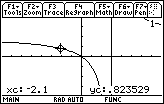
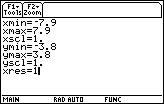
ZoomDec automatically changes the viewing window to [-7.9, 7.9] x [-3.8, 3.8]. In this window, the x-values are even tenths (..., -0.2; -0.1, 0, 0.1, 0.2,...) and the space between pixels is 0.1. But assuming that xres is set to the default value of 2 in the window screen, when you trace using the arrow keys the x-values change by 0.2. Because xres is set at 2, the TI-89 will calculate values for every other column of pixels. The hole still does not appear on this graph because the x-values used to draw the graph skip from x = -1.9 to x = -2.1 and x = -2 is not evaluated.
Resetting xres
You can modify the viewing window so the TI-89 calculates values for every column of pixels by changing the value of "xres" in the Window screen.
- Open the Window screen and change "xres" to 1
-
Return to the graph by pressing
 [GRAPH]
Now you should be able to see the tiny hole at
![]() and when you trace using the arrow keys, you can see that the function is undefined when x = –2.
and when you trace using the arrow keys, you can see that the function is undefined when x = –2.
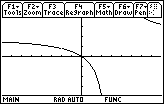
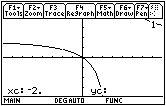
The choice of Window values will determine whether or not a hole in the graph of a function will actually be visible on the graphing screen.
5.2.2 Find the vertical asymptote and the hole in the graph of
![]() by using the zero( and the limit( functions, and then verify your findings by displaying the graph. Click here for the answer.
by using the zero( and the limit( functions, and then verify your findings by displaying the graph. Click here for the answer.