In lesson 5.1 you found vertical and horizontal asymptotes of a rational function. In this lesson you will see an
oblique
(slanted) asymptote of a rational function. You can make this oblique asymptote obvious by adjusting the Window values before graphing the function, and the propFrac( command will be useful in finding the equation for the oblique asymptote.
![]()
![]()
An oblique, or slanted, asymptote is a nonvertical and nonhorizontal line that the graph of a function approaches as the input gets large without bound.
![]()
![]()
Investigating
![]()
-
Graph the rational function
 in a [-10, 10] x [-20,10] viewing window.
You may want to change the resolution (xres) back to 2 to speed up the graphing process.
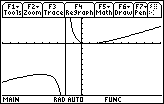
There appears to be a vertical asymptote at x = -2, which corresponds to the zero of the denominator in the rational function. However there does not seem to be a horizontal asymptote.
5.3.1 Verify that there is no horizontal asymptote by evaluating
![]() and
and
![]() . Click here for the answer.
. Click here for the answer.
However, there is an important feature of the rational function as x approaches infinity that is not obvious from simply evaluating the limits.
In order to see this feature,
- Change the Window values to [-100, 100] x [-200, 100]
- Set xcsl and yscl equal 10
- Display the graph of the function
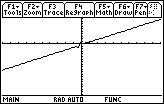
The graph appears to be a line with a small wiggle near the y-axis. This slanted line is an oblique asymptote for the rational function
![]() .
.
Finding the Oblique Asymptote
You can find the equation of an oblique asymptote by converting the rational function to a polynomial plus a
proper fraction
. The propFrac( command performs this operation.
![]()
![]()
A proper fraction is a rational expression in which the degree of the numerator is less than the degree of the denominator. An improper fraction is a rational expression in which the degree of the numerator is greater than or equal to the degree of the denominator. An improper fraction may be changed into a polynomial plus a proper fraction by dividing the numerator by the denominator. Any remainder is written as the numerator of a proper fraction whose denominator is the divisor.
![]()
![]()
To write
![]() as a polynomial plus a proper fraction,
as a polynomial plus a proper fraction,
-
Return to the Home Screen by pressing

-
Display the Algebra menu by pressing

- Select the seventh element in the Algebra menu, 7:propFrac(
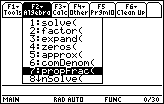
This command converts a rational expression to a polynomial plus a proper fraction.
-
Paste the propFrac( command to the Edit Line by pressing

- Complete the command propFrac((x^2-2x+1)/(x+2))
-
Display the result by pressing

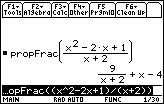
The result is the sum of a proper fraction
![]() and a linear polynomial function x – 4. The linear function y = x – 4 is the equation of the oblique asymptote.
and a linear polynomial function x – 4. The linear function y = x – 4 is the equation of the oblique asymptote.
The Wide View
Graphical support that y = x – 4 is an oblique asymptote is provided by graphing both the line and the rational function in a [-100, 100] x [-100, 100] window.
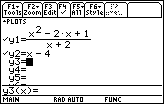
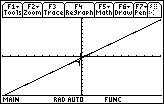
The graphs of the rational function and the line appear to coincide in this window.
The Graphs Differ
To see how the graphs differ,
- Display the graphs in a [-10, 10] x [-20, 10] window
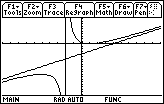
Notice that the appearance of the graph of a rational function is dramatically affected by the choice of Window values. In a large viewing window the graph of the rational function
![]() looks like the graph of the line y = x – 4, but in a smaller window, the graphs are not similar.
looks like the graph of the line y = x – 4, but in a smaller window, the graphs are not similar.
The Narrow View
Now compare the graphs of the original rational function and the proper fraction
![]() .
.
-
Change y2 in the Y= Editor to y2 =

- Change the Window values to [-3, -1] x [-200, 100].
- Set xscl = 1 and yscl = 10
- Display the graphs
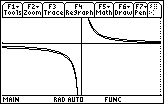
Near the vertical asymptote at x = –2 the graph of the rational function
![]() looks like the graph of y =
looks like the graph of y =
![]() , the proper fraction.
, the proper fraction.
5.3.2 Discuss the graph of
![]() then verify your answer by displaying the graph in a large window and in a window near x = 2. Click here for the answer.
then verify your answer by displaying the graph in a large window and in a window near x = 2. Click here for the answer.