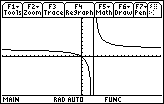
It appears that:
Vertical asymptote: x = 3
Horizontal asymptote: y = 2
You cannot really be sure from the graph. You need to apply analytic techniques as we will illustrate.
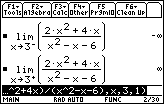
Because the values of the function in absolute value increase without bound as x approaches 3 from the left and from the right, x = 3 is a vertical asymptote. Notice that
![]() means as x
means as x
![]() 3–, f(x)
3–, f(x)
![]() –
–
![]()
![]() means as, x
means as, x
![]() 3+, f(x)
3+, f(x)
![]()
![]()
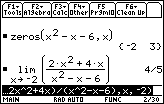
Because
![]() , which is not
, which is not
![]() or –
or –
![]() , x = –2 is not a vertical asymptote.
, x = –2 is not a vertical asymptote.
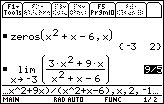
Because
![]() , there is a hole at x = –3 and not a vertical asymptote there.
, there is a hole at x = –3 and not a vertical asymptote there.
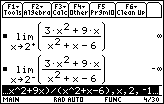
Because
![]() and
and
![]() , x = 2 is a vertical asymptote.
, x = 2 is a vertical asymptote.
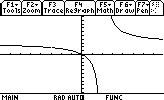
The Window values shown are [–7.9, 7.9] x [–10, 10] with xres = 1.
There is a tiny hole at
![]() and x = 2 is a vertical asymptote. Because xres is 1 and a pixel represents x = 2, the calculator evaluated the function at x = 2 and determined that the function was not defined there. That is why there is no vertical line shown at x = 2.
and x = 2 is a vertical asymptote. Because xres is 1 and a pixel represents x = 2, the calculator evaluated the function at x = 2 and determined that the function was not defined there. That is why there is no vertical line shown at x = 2.
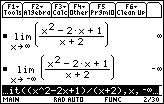
Because the function does not approach a finite real number as the magnitude of x gets large without bound, no horizontal line is an asymptote.
![]()
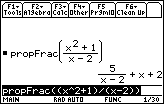
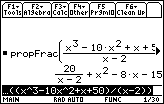
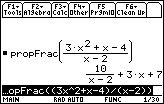
The vertical asymptote is x = 2 and the oblique asymptote is y = x + 2. In a large window the graph of
![]() is similar to y = x + 2, the oblique asymptote. In a window near x = 2 the graph is similar to
is similar to y = x + 2, the oblique asymptote. In a window near x = 2 the graph is similar to
![]() .
.
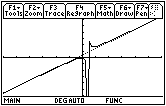
The Window shown is [–30, 30] x [–30, 30], xscl = yscl = 5, and the oblique asymptote y = x + 2 is shown as a dotted line.
The style of a selected graph may be chosen from the Style menu, which is displayed by pressing
![]()
![]() in the Y= editor while the function in question is highlighted. The style of y = x + 2 was chosen to be dotted.
in the Y= editor while the function in question is highlighted. The style of y = x + 2 was chosen to be dotted.
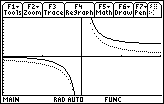
The Window shown is [0, 4] x [–25, 25]. The graph of
![]() is shown as a dotted curve.
is shown as a dotted curve.
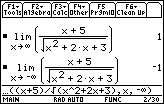
The two horizontal asymptotes of this function are y = 1 and y = –1.
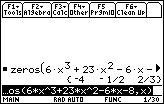
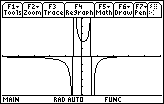
[–5, 5] x [–5, 5]
There appear to be vertical asymptotes at
![]() and
and
![]() but not x = – 4
but not x = – 4
©Copyright 2007 All rights reserved. | Trademarks | Privacy Policy | Link Policy