A capacitor stores electrical energy that can be discharged quickly or slowly. For example, energy from a battery is stored in a camera's capacitor and then the voltage quickly discharges to create the bright flash of light from the flash bulb.
In this lesson you will examine data produced by a capacitor as it discharges. The discharge discussed here is much slower than that of a flash bulb because an electronic resistor, which retards the discharge, is placed in the circuit with the capacitor.
The Voltage Equation
When a capacitor discharges through a resistor, the voltage across the capacitor decreases at a rate proportional to the amount of remaining voltage. The situation is described by the same basic differential equation that was explored in the previous two lessons.
In the equations above, V represents the voltage across the capacitor at any time t, k represents a negative parameter that depends on the physical characteristics of the capacitor and resistor, and V0 represents the capacitor's initial voltage.
The TI-83 can accept real-world data, plot the data, and display a graph of the voltage across the capacitor. The data can be used to find values for V0 and k, leading to a solution of the initial value problem given above. The particular solution can then be used to calculate the voltage across the capacitor at any given time.
Getting the Data
The data from the capacitor experiment are stored in lists L1 and L2, which should be downloaded to your computer and calculator.
Downloading the Data to Your Computer
- Click on L1 to download that data to your computer.
- Choose to save the file.
- Save the file on your local hard disk on the desktop or in a folder that you can access later.
- Repeat the process for L2.
Click here to get information about how to obtain the needed cable and to review the procedure to transfer the lists from your computer to your calculator.
- Send the lists L1 and L2 from your computer to your TI-83.
Time, measured in seconds, is in L1 and voltage, measured in volts, is in L2.
Plotting the Data and Solving the Differential Equation
- Define a scatter plot with L1 in the Xlist and L2 in the Ylist.
- Select "Dot" as the Mark type.

-
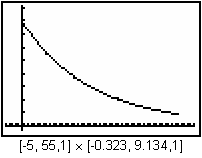
Use a ZoomStat window and display the graph by pressing

 .
.

Writing the Equation
The graph of the data shows the particular solution to the differential equation
That is, the equation that corresponds to the graph has the form V = V0ek · t.
The equation that models the scatter plot can be found by using two points of the data, the initial value and another point. Specific values in the data set can be found by using the Trace feature of the Graph screen.
- Press
 .
.

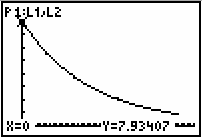
The graph indicates that the initial voltage was V0
![]() 7.93407 volts. Other values may be found by using the arrow keys.
7.93407 volts. Other values may be found by using the arrow keys.
We will use this initial voltage in the model of the voltage. The resulting differential equation is given in Question 21.3.1.
21.3.1 Solve the initial-value problem
![]() and V(0) = 7.93407.
and V(0) = 7.93407.
Click here for the answer.
To find the value of k, use another point on the graph.
-
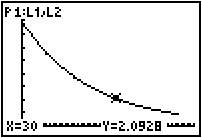
Return to the graph and trace to t = 30 seconds.

Substituting these values into the equation gives:
| 2.0928 = 7.93407e30k | |
| 0.26377 = e30k | Divide both sides by 7.93407. |
| ln(0.26377) = 30 k | Take natural logarithms of both sides. |
|
k
|
Divide both sides by 30. |
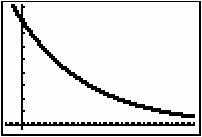
Now graph the function to see that the equation fits the original data.
- Set Y1 = 7.93407e^(-0.04442X).
- Change the graphing style to thick.
- Plot1 should still be selected.

-
Press
 to see the graph drawn over the scatter plot.

The model could be different if you choose a point other than (30, 2.0928) when finding k.
21.3.2 Trace on the scatter plot of the data to t = 50 and write down the corresponding value of V. Use this value of V to find a new value for k. How well does the solution to the differential equation using this value of k fit the original data?
Click here for the answer.
Finding Half-Life
21.3.3 Find the half-life of the capacitor by solving the equation
![]() for t.
for t.
Click here for the answer.