In the previous lesson you started with an equation and found the corresponding graph by looking at the transformations of the basic graph. A more realistic situation might be to start with a graph of real-world data and then find an equation to fit the data. This can be done on your TI-83 using regression. If the data appear to be sinusoidal, then you can use sine regression. In this lesson you will download data sets produced by a turning fork to your calculator and explore finding the equation that fits the data.
Tuning Fork Data
A vibrating object that disturbs the surrounding air and causes the air molecules to vibrate produces sound. These vibrations cause a periodic change in air pressure that travels through the air much like ripples on a body of water. The air pressure waves are more commonly called sound waves. Although most sounds are a combination of many different sounds, the sound from a turning fork is a single tone that can be described mathematically using a transformed sine function.
A Texas Instruments CBL™ and microphone probe were used to measure a sound wave from a tuning fork. The information in the data will allow you to determine the specific note that was sounded.
Downloading the Data to Your Computer
- The data are at the two links L1 and L2. Right-click on each link and choose to save the link as a file on your computer. L1, L2
- Save the files on your local hard disk on the desktop or in a folder that you can access later.
Transferring the Data to the TI-83
Click here to get information about how to obtain the needed cable and to review the procedure to transfer the lists from your computer to your calculator.
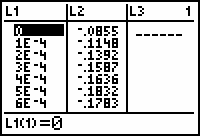
- Send the lists L1 and L2 from your computer to your TI-83.
- Display the Stat List editor to confirm that the lists were stored.
Plotting the Data
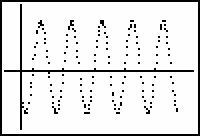
- Define a scatter plot with L1 in the X-list and L2 in the Y-list.
- Select dots as the Mark type.
- Select ZoomStat from the ZOOM menu and display the graph.

Sine Regression
Because the graph appears to be a transformed sine function, perform sine regression and store the regression equation.
-
Open the STAT CALC menu by pressing

 .
.
-
Highlight C:SinReg by pressing
 repeatedly or by pressing
 once.
once.
-
Paste the SinReg command to the Home screen by pressing

-
Complete the sine regression command "SinReg L1,L2,Y1".
Recall that L1 and L2 are above and
and
 , and that Y1 is found by pressing


 .
.
-
Execute the command by pressing
 .
.
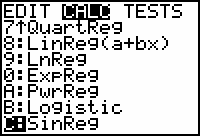

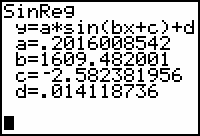
After a minute or two a sine equation that fits the data will be displayed on the Home screen and stored in Y1.
The Forms
![]()
Notice that the regression equation is slightly different from the form y = Asin[B(x + C] + D described in Lesson 4.2. A, B and D are the same as the values in the regression equation, but the value of C in the transformed equation is found by dividing the value of C in the regression equation by the value of B. B must be factored out to determine the horizontal shift of the transformed graph.
The transformed regression equation has the characteristics listed below.
|
A
|
Compress vertically by a factor of 0.202. |
|
B
|
The period of the transformed graph is
|
|
|
Horizontal shift right 0.00160 units. |
|
D
|
Vertical shift up by 0.0141 units. |
-
Press
 to see the graph of the regression equation along with the scatter plot.
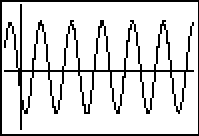
Period and Frequency
The period of this sine wave is
![]() , which indicates that it takes approximately 0.004 seconds per cycle. The frequency, which is the reciprocal of the period, is
, which indicates that it takes approximately 0.004 seconds per cycle. The frequency, which is the reciprocal of the period, is
![]() cycles per second.
cycles per second.
The Tuning Fork's Note
A frequency of 256 cycles per second is the frequency of the note middle C, so the tuning fork must be a "C".
4.3.1 The period is the distance from one peak to the next peak. If another tuning fork were used with a higher frequency than the tuning fork in this lesson, how would its graph compare with the graph above? Write your response then click here for the answer.