In this lesson you will use parametric equations to illustrate the connection between the graphs of y = sin(x) and the unit circle. You will also see how to transform the graph of y = sin(x) to obtain the graph of y = sin[B(x + C)] + D.
Exploring x = cos t, y = sin t
Before investigating the relationship between the sine function and the unit circle, examine the parametric equations shown below.
For
![]() , predict the shape of the curve that is produced by the parametric equations
, predict the shape of the curve that is produced by the parametric equations
y = sin t
4.2.1 Make sure your calculator is in Radian mode by checking the MODE menu. Graph the parametric equations to verify your prediction. Click here for the answer.
|
|||
|
|
|||
The Sine Function
The sine function can be defined in several ways. One way is to let sin t be the y-coordinate of the point on the unit circle whose intercepted arc is t units long, which is another way of saying that the associated central angle is t radians.
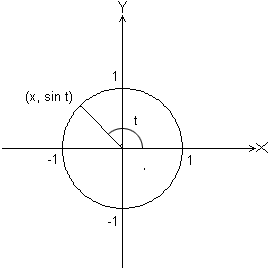
Recall that the sine wave has the following shape:
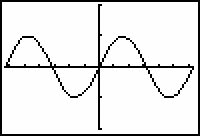
The relationship between the graph of y = sin x and the unit circle's y-values can be illustrated by graphing both simultaneously.
Sequential and Simultaneous Graphing Modes
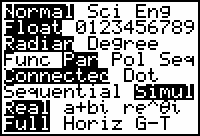
In the sixth row of the MODE menu, the options are Sequential or Simultaneous (Simul). (See the screen below.) In Sequential mode, graphs are drawn one at a time in the order listed in the Y= editor. In Simultaneous mode, all graphs in the Y= editor are drawn at the same time rather than sequentially.
Select the following settings in the MODE menu to have parametric equations graphed simultaneously.
Unwrapping the Sine Wave
- Enter the equations for the unit circle and for the sine function shown in the Y= editor below.
-
Set the window values to [0, 2
 , 0.05] x [-2, 2
 , 1] x [-2.7, 2.7, 1].
 is above
 .
.
-
Display the graphs of the equations.
As the graphs are drawn look for the relationship between the two graphs.
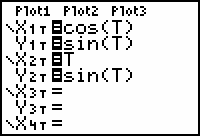
|
|||
|
|
|||
4.2.2 Describe the relationship you see between the circle and the sine wave. Click here for the answer.
A Periodic Function and Its Period
A periodic function has y-values that repeat over specific intervals of x-values. The period of a periodic function is the length of an x-interval over which the y-values make one complete cycle. The sine function has a period of 2
![]() , which is the number of radians in one complete revolution.
, which is the number of radians in one complete revolution.
A Transformed Sine Curve
The graph of y = Asin[B(x + C)] + D is a transformed version of the graph of y = sin(x). The effects of each of the values of A, B, C, and D are listed below. The transformations were discussed in Module 3.
A produces a vertical stretch or shrink by a factor of A; and a reflection about the x-axis if A is negative.
A is also called the amplitude of the sine wave, which is half the distance between the highest and lowest y-values of the graph.
B produces a horizontal stretch or shrink, which changes the period of the curve. The period of the transformed sine wave is
![]() . If B is negative there is a reflection about the y-axis.
. If B is negative there is a reflection about the y-axis.
C produces a horizontal shift.
D produces a vertical shift.
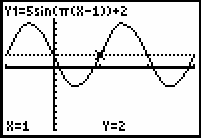
The graph of y = 5sin[
![]() (x - 1)] + 2 is the transformed graph of y = sin x that has the following characteristics:
(x - 1)] + 2 is the transformed graph of y = sin x that has the following characteristics:
Amplitude of 5 (stretched vertically by a factor of 5)
Period of
![]() (compressed horizontally by a factor of
(compressed horizontally by a factor of
![]() )
)
Shifted horizontally right 1 unit
Shifted vertically up 2 units
- Return to Function and Sequential modes in the MODE menu.
-
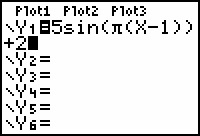
Graph y = 5sin(
 (x - 1)) + 2 in a [-1, 3, 1] x [-10, 10, 1] window.
Press
![]()
![]() to enter
to enter
![]() and make sure you enter the parentheses correctly.
and make sure you enter the parentheses correctly.
|
|
| The dotted line is y = 2 and the cursor is positioned at (1, 2) to illustrate the horizontal and vertical shifts. |
4.2.3 Describe the transformations of y = sin(x) that produce the graph of y = -3sin[2(x + 1)] -4 then graph the equation on your calculator. Click here for the answer.