In this lesson the graphs of parametric curves are explored, window parameters of the Parametric mode are discussed and inverse parametric relations are graphed.
Comparing Function and Parametric Modes
In Function graphing mode, the independent variable is x and the dependent variable is y. Each value chosen for x produces exactly one value for y and together they indicate a point (x, y) on the graph of the function.
When graphing equations in Parametric mode, the independent variable is t and the two dependent variables are x and y. In other words, x and y are both functions of a common parameter t and each value of t produces exactly one point (x, y) on the graph. Letting t take on consecutive values in an interval [tmin, tmax], the graph of a parametric function is created by plotting the corresponding points (x, y).
Graphing Functions using Parametric Mode
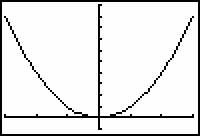
Graphing the function y = x2 in Function mode produces a parabola. The same curve can also be graphed in Parametric mode by using the equations below, where the value of x is the same as the value of t and the y-value is t2.
y = t2
-
Open the Mode menu by pressing
 .
.
-
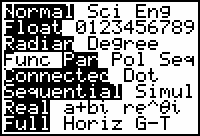
Select Parametric mode by highlighting "Par" and pressing
 .
.
The graphing modes, which are in the fourth row of the Mode menu, include Func (Function), Par (Parametric), Pol (Polar), and Seq (Sequence). -
Exit the Mode menu by pressing
 [QUIT].
-
Open the Y= editor by pressing
 .
.
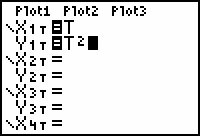
Notice that the Parametric editor (also called the Y= editor) is different than the Function editor. -
Enter X1T= T and Y1T = T2
Use the key to enter T and the square key,
 , to square T.


Entering the Window Parameters
Parametric mode requires the beginning and ending values of the independent variable t, entered as Tmin and Tmax, and the amount of change between consecutive values of t, entered as Tstep. The graph will be displayed in a window determined by the x and y parameters.
-
Open the Window editor by pressing
 .
.
-
Enter the following values:
Tmin = -3 Xmin = -3 Ymin = -1 Tmax = 3 Xmax = 3 Ymax = 10 Tstep = 0.1 Xscl = 1 Yscl = 1
The following notation will be used to designate the Parametric mode window parameters:
In this notation, the parameters for the above window are
The t-values will begin at t = -3 and include all increments of 0.1 up to t = 3. That is, the t-values are
Each t-value generates a point (t, t2) = (x, y) that will be plotted.
The graph of the points (x, y) will be displayed in a [-3, 3] x [-1, 10] window with tick marks every unit on both axes.
-
Display the graph by pressing
 .
.

This is the same graph that would be produced by graphing y = x2 in Function mode.
Controlling the Graph's Appearance
In Parametric mode you have more control over the appearance of the graph than in Function mode.
4.1.1 What will happen to the graph if you let Tmin = 0 in the Window editor? Sketch your prediction then make the change on your TI-83 and display the graph with the new value of Tmin. Click here for the answer.
Before proceeding, change tmin back to -3 and change the vertical display by adjusting the y values to be between -3 and 3:
- Set the window values to [-3, 3, 0.1] x [-3, 3, 1] x [-3, 3, 1].
Inverse Functions
Conceptually, an inverse of a function is a relation that "undoes" whatever the function "does." For example, because addition and subtraction are inverse operations the functions f(x) = x + 1 and g(x) = x - 1 are inverses of each other. If you successively apply the two functions, the final result should be the value with which you started. Start with x = 4 and examine the effect of applying each function in turn, which adds one then subtracts one.
Starting with x = 4, f(4) = 4 + 1 = 5.
Next evaluate the function g(x) with x = 5.
For x = 5, g(5) = 5 - 1 = 4, the original x-value.
A similar argument shows that subtracting one and then adding one will result in the original x-value.
In other words, for these two functions, f(g(x) = x and g(f(x) = x for all values of x. Two functions f and g are inverse functions if and only if these two equations hold for all values of x in the correct domains.
Not all functions have inverses that are also functions. The inverse relation of
y = x2 is
![]() , which is not a single function. In
, which is not a single function. In
![]() , each positive x-value produces two y-values, so it is not a function.
, each positive x-value produces two y-values, so it is not a function.
Finding Inverses
Inverses may be found by exchanging the x- and y-values. Because the x- and y-values are defined separately in parametric equations, it is very easy to produce the inverse of a function written in parametric mode.
Exchanging x and y
4.1.2 Describe what will happen to the graph of X1T = T and Y1T = T2 if you swap the values of X1T and Y1T. Sketch your prediction then enter X1T = T2 and Y1T = T and display the graph to verify your prediction. Click here for the answer.
The inverse relation of the parabola y = x2 is not a function because when x = 1, y = -1 or y = 1.
Graphing Curves That Are Not Functions
As shown above, any function y = f(x) can be graphed in Parametric mode by letting x = t and y = f(t). The inverse of a function can be created by swapping the values of x and y. That is, the inverse of y = f(x) is found by letting x = f(t) and y = t. Such curves, which are not necessarily functions, can be graphed in Parametric mode.
4.1.3 Discuss the relationship between the graph of y = (x - 3)2 and the graph of it's inverse, and graph both y = (x - 3)2 and its inverse in Parametric mode. Determine if the inverse of y = (x - 3)2 is a function. Click here for the answer.