Education Technology

TI-Nspire™ CX & TI-Nspire™ CX CAS Teacher Software

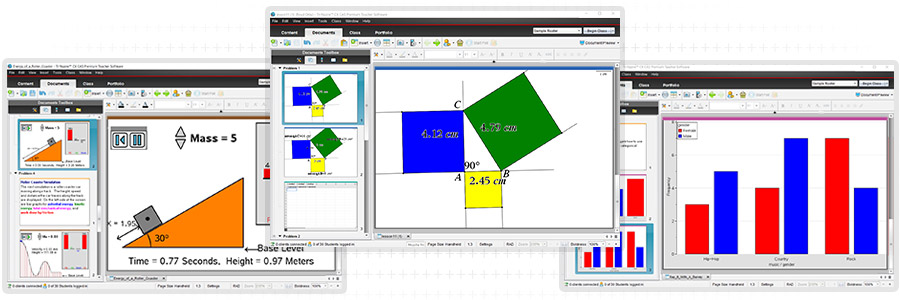
This interactive software lets educators present math and science concepts to the class, demonstrate the use of
TI-Nspire™ CX handhelds, transfer documents and create
self-check questions for student self-assessment.

Where to Buy

Python logo Python programming is now available on TI-Nspire™ CX II
family graphing calculators and software.

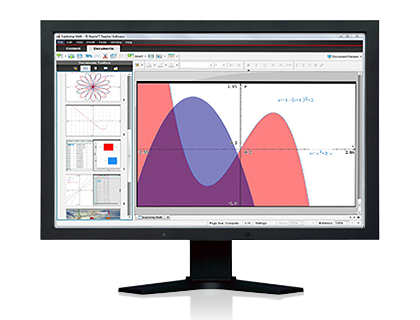
Calculate, graph, write notes, build spreadsheets and create self-check questions, all with TI-Nspire™ CX and TI-Nspire™ CX CAS Teacher Software.

gen-product-app-icon-calculator Calculator
Perform computations and enter expressions, equations and formulas in proper math notation.
gen-product-app-icon-spreadsheets Lists & Spreadsheet
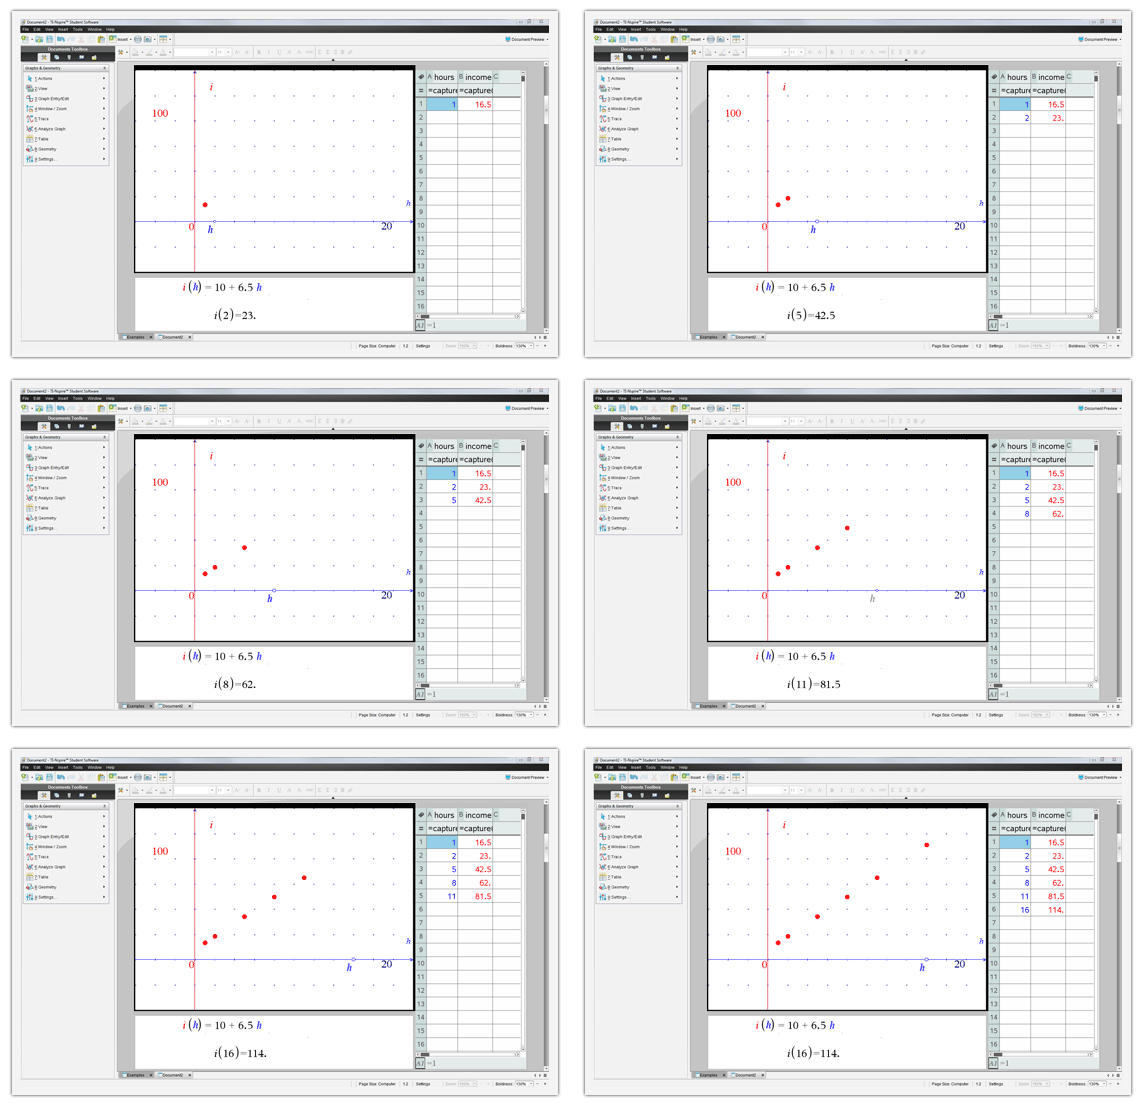
Perform mathematical operations on data and visualize the connections between the data and their plots.
gen-product-app-icon-graph Graphs
Plot and explore functions, equations and inequalities, animate points on objects and graphs, use sliders to explain their behavior and more.
gen-product-app-icon-notes Notes
Put the math and science in writing by adding notes or steps to a document.
gen-product-app-icon-geometry Geometry
Construct and explore geometric figures and create animations.
gen-product-app-icon-data-lists Data & Statistics
Summarize and analyze data using different graphical methods such as histograms, box plots, bar and pie charts and more.
gen-product-app-icon-dataquest Vernier DataQuest™ Application
Create a hypothesis graphically and replay data collection experiments all in a single application. The DataQuest™ Application supports more than 60 Vernier Software & Technology™ data collection sensors.

Vernier DataQuest™ is a trademark of Vernier Software & Technology.

gen-product-app-icon-question Question
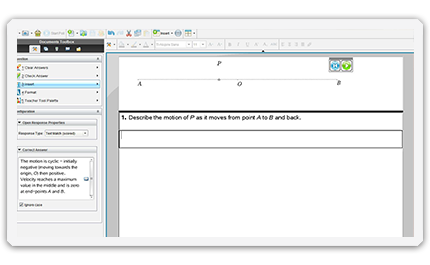
Question Application allows educators to write gradable or self-check questions to guide students through an activity.

Explore concepts

The built-in TI-SmartView™ emulator allows educators to project an interactive display of the TI-Nspire™ CX handheld screen and show multiple representations of a problem to help students visualize connections and keystrokes.

Maximize class time, maximize learning time

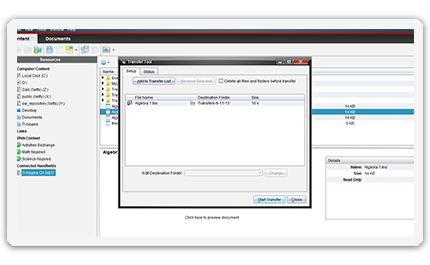
Create, customize, organize and share TI-Nspire™ documents and manage classroom activities by sending content to multiple student handhelds simultaneously. Use the TI-Nspire™ Docking Station to quickly transfer documents to up to 10 student handhelds at the same time.

Create questions for student self-assessment

The Question Application allows educators to write questions to guide students through an activity; using the self-check feature, students can check their current level of understanding and decide if they can move on to the next mathematical concept.

TI-Nspire™ CX & TI-Nspire™ CX CAS Teacher Software Specifications

Built-in functionality

  • Includes two pieces of software (1) TI-Nspire™ Teacher Software and (2) TI-Nspire™ CAS Teacher Software, which includes built-in Computer Algebra System (CAS) capabilities
  • Built-in TI-SmartView™ emulator to demonstrate the use of TI-Nspire™ handhelds
  • Question App to create different question types including free response, multiple choice, true/false, equations, coordinate points, images and expressions
  • Content Workspace to access your personal online files on your desktop or on the web and pre-authored content from sites like MathNspired or ScienceNspired
  • Function, parametric, polar, conic, sequence and 3-D graphing
  • Multiple graphing functions can be defined, saved, graphed and analyzed at one time
  • MathDraw, use touchscreen or mouse gestures to create points, lines, triangles, and other shapes
  • User-defined list names in Lists & Spreadsheet application
  • Eleven interactive zoom features
  • Numeric evaluations in table format for all graphing modes
  • Interactive analysis of function values, roots, maximums, minimums, integrals and derivatives
  • Six different graph styles and 15 colors to select from for differentiating the look of each graph drawn
  • Matrix operations: transpose and augment matrices; use elementary row operations; find inverse, determinant and reduced row echelon forms; convert matrices to lists and vice versa; calculate eigenvalues and eigenvectors
  • List-based, one- and two-variable statistical analysis, including logistic, sinusoidal, median-median, linear, logarithmic, exponential, power, quadratic polynomial, cubic polynomial and quartic polynomial regression models
  • Three statistical plot definitions for scatter plots, xy-line plots, histograms, regular and modified box-and-whisker plots and normal probability plots
  • Advanced statistics analysis, including 10 hypothesis testing functions, seven confidence interval functions and one-way analysis of variance
  • Eighteen probability distributions functions, including the cumulative distribution function (CDF), probability density function (PDF) and inverse probability distribution function for normal, chi-squared, t-, and F- distributions; and the CDF and PDF for binomial, geometric and Poisson distributions
  • Built-in interactive geometry capabilities
  • TI-Nspire™ documents (.tns files) — compatible with TI-Nspire™ Software, TI-Nspire™ handhelds and TI-Nspire™ Apps for iPad® — can be created, edited, saved and reviewed
  • Use images (.jpeg, .jpg, .bmp, .png formats) that can be overlaid with graphical elements
  • Explore mathematical expressions in symbolic form, see patterns and understand the math behind the formulas
  • Chem Box feature allows easy input chemical formulas and equations
  • Visualize multiple representations of a single problem in algebraic, graphical, geometric, numeric and written forms
  • Manipulate linked representations of properties to instantly update the others and show meaningful connections without switching screens (e.g., grab a graphed function and move it to see the effect on corresponding equations and data lists)

Programming

  • Features a dedicated programming environment as well as programming libraries for global access to user-defined functions & programs

System requirements


Windows® system requirements
  • Windows OS Windows® 7 SP1, Windows 8.1 and 8.1 Pro Update 1, Windows 10
  • Compatible with 32-bit and 64-bit Operating Systems
  • Processor Speed: Intel Core i3 or higher generation processor (Except Intel Atom)
  • RAM: 2 GB
  • Hard drive: Approximately 1 GB of available hard-disk space
  • Screen resolution: 1024 x 768 (minimum) - 1920 x 1080 (maximum)
  • DVD-ROM drive or active internet connection for installation
Mac® system requirements
  • Mac® OS X 10.11, 10.12
  • Processor: Any Mac 2008 or newer
  • RAM: 2 GB
  • Hard Drive: Approximately 500 MB of available hard-disk space
  • Java for Mac OS X 10.6 Update 15, Java for OS X 2013-003
  • Screen resolution: 1024 x 768
  • DVD-ROM drive or active internet connection for installation

Licensing options


Single-user license (PC and Mac®)
  • Provides one software license for one computer
Volume License (PC and Mac®)
  • Allows access to the software on a fixed number of computers
  • Software can be deployed with many standard deployment methods
  • Software is activated online
  • Software not required to be connected to the network in order to be used

Data collection support

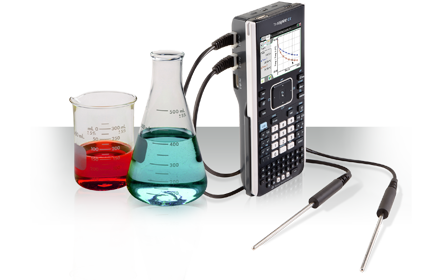
  • Compatible with TI-Nspire™ Lab Cradle, Vernier EasyLink® USB Sensor and Vernier EasyTemp® USB temperature sensor systems to allow collection and analysis of real-world data

Support

TI-Nspire™ CX & TI-Nspire™ CX CAS Teacher Software Accessories

TI-Nspire™ Lab Cradle

Expand your scientific range

The TI-Nspire™ Lab Cradle combines with the Vernier DataQuest™ Application and a selection of more than 60 data collection sensors to take science teaching and learning into new dimensions of student engagement and visualization of concepts.

This versatile, portable learning tool supports single- and multi-sensor data collection and analysis.

Key features of the Vernier DataQuest™ Application include:

  • Plug-and-play simplicity that turns the TI-Nspire™ computer software into an adaptable data collection tool
  • Real-time data collection analysis that enables student to associate an event with its representation in a graph, table or meter
  • Analytic tools that equip students for precise selection and focus on collected data
  • Draw Prediction feature that enables student to create hypotheses and replay collected data to compare outcome

The Vernier EasyLink® USB sensor interface individually connects with more than 60 standard Vernier sensors to make data collection fun, faster, more accurate and more intuitive, and the Vernier EasyTemp® temperature sensor provides a simple, accurate and inexpensive way to get students started collecting real-world data.