ZIP
Mathematics lessons for IB® Diploma Programme
Applications and Interpretation | Probability and Statistics
Two-Way Tables and Association
Activity Overview
This lesson involves analyzing the results of a survey using a two-way frequency table.
As a result, students will:
- Interpret what the values mean in both the frequency table and conditional probability table.
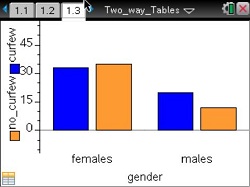
- Use a graph of the relationship between two items from the survey to report conditional probabilities.
- Generate a simulated sampling distribution and interpret how likely a given outcome is expected to occur.
Objectives
- Students will be able to summarize data from a two-way frequency table.
- Students will be able to interpret conditional probabilities from a two-way table.
- Students will be able to interpret expected values from a simulation as an estimate of outcomes.
- Students will be able to interpret expected values as an indication of association.
Vocabulary
- association
- conditional probability table
- random sample
- survey
- two-way frequency table