|
Catalog > |
|
|
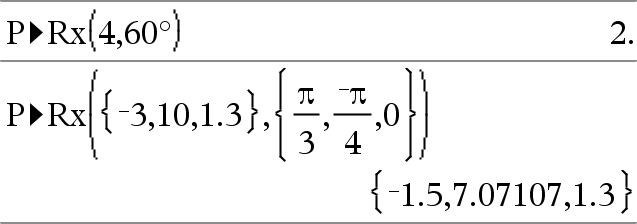
P►Rx(rExpr, θExpr) ⇒ expression Returns the equivalent x-coordinate of the (r, θ) pair. Note: The θ argument is interpreted as either a degree, gradian or radian angle, according to the current angle mode. If the argument is an expression, you can use °, G, or r to override the angle mode setting temporarily. Note: You can insert this function from the computer keyboard by typing P@>Rx(...). |
In Radian angle mode:
|
|
Catalog > |
|
|
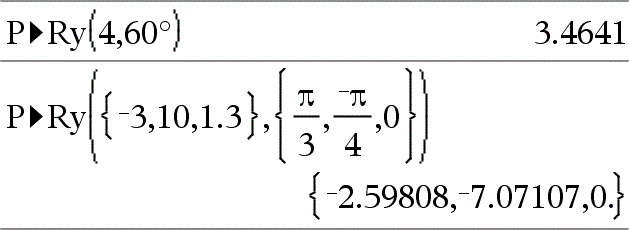
Returns the equivalent y-coordinate of the (r, θ) pair. Note: The θ argument is interpreted as either a degree, radian or gradian angle, according to the current angle mode.°r Note: You can insert this function from the computer keyboard by typing P@>Ry(...). |
In Radian angle mode:
|
|
Catalog > |
|
|
PassErr Passes an error to the next level. If system variable errCode is zero, PassErr does not do anything. The Else clause of the Try...Else...EndTry block should use ClrErr or PassErr. If the error is to be processed or ignored, use ClrErr. If what to do with the error is not known, use PassErr to send it to the next error handler. If there are no more pending Try...Else...EndTry error handlers, the error dialog box will be displayed as normal. Note: See also ClrErr, here, and Try, here. Note for entering the example: For instructions on entering multi-line program and function definitions, refer to the Calculator section of your product guidebook. |
For an example of PassErr, See Example 2 under the Try command, here. |
|
Catalog > |
|
|
piecewise(Expr1[, Cond1[, Expr2 [, Cond2[, … ]]]]) Returns definitions for a piecewise function in the form of a list. You can also create piecewise definitions by using a template. Note: See also Piecewise template, here. |
|
|
Catalog > |
|
|
poissCdf(λ,lowBound,upBound) ⇒ number if lowBound and upBound are numbers, list if lowBound and upBound are lists poissCdf(λ,upBound)for P(0≤X≤upBound) ⇒ number if upBound is a number, list if upBound is a list Computes a cumulative probability for the discrete Poisson distribution with specified mean λ. For P(X ≤ upBound), set lowBound=0 |
|
|
Catalog > |
|
|
poissPdf(λ,XVal) ⇒ number if XVal is a number, list if XVal is a list Computes a probability for the discrete Poisson distribution with the specified mean λ. |
|
|
Catalog > |
|||||||
|
Vector ►Polar Note: You can insert this operator from the computer keyboard by typing @>Polar. Displays vector in polar form [r∠θ]. The vector must be of dimension 2 and can be a row or a column. Note: ►Polar is a display-format instruction, not a conversion function. You can use it only at the end of an entry line, and it does not update ans. Note: See also ►Rect, here. |
|
||||||
|
complexValue ►Polar Displays complexVector in polar form.
complexValue can have any complex form. However, an reiθ entry causes an error in Degree angle mode. Note: You must use the parentheses for an (r∠θ) polar entry. |
In Radian angle mode:
|
|
Catalog > |
|
|
polyEval(List1, Expr1) ⇒ expression Interprets the first argument as the coefficient of a descending-degree polynomial, and returns the polynomial evaluated for the value of the second argument. |
|
|
Catalog > |
|
|
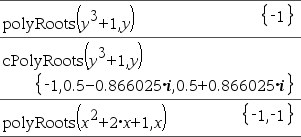
The first syntax,
The second syntax, Note: See also |
|
|
Catalog > |
|
|
PowerReg X,Y[, Freq][, Category, Include]] Computes the power regressiony = (a•(x)b)on lists X and Y with frequency Freq. A summary of results is stored in the stat.results variable. (See here.) All the lists must have equal dimension except for Include. X and Y are lists of independent and dependent variables. Freq is an optional list of frequency values. Each element in Freq specifies the frequency of occurrence for each corresponding X and Y data point. The default value is 1. All elements must be integers ≥ 0. Category is a list of Include is a list of one or more of the category codes. Only those data items whose category code is included in this list are included in the calculation. For information on the effect of empty elements in a list, see “Empty (Void) Elements,” here. |
|
|
Output variable |
Description |
|
stat.RegEqn |
Regression equation: a•(x)b |
|
stat.a, stat.b |
Regression coefficients |
|
stat.r2 |
Coefficient of linear determination for transformed data |
|
stat.r |
Correlation coefficient for transformed data (ln(x), ln(y)) |
|
stat.Resid |
Residuals associated with the power model |
|
stat.ResidTrans |
Residuals associated with linear fit of transformed data |
|
stat.XReg |
List of data points in the modified X List actually used in the regression based on restrictions of Freq, Category List, and Include Categories |
|
stat.YReg |
List of data points in the modified Y List actually used in the regression based on restrictions of Freq, Category List, and Include Categories |
|
stat.FreqReg |
List of frequencies corresponding to stat.XReg and stat.YReg |
|
Catalog > |
|
|
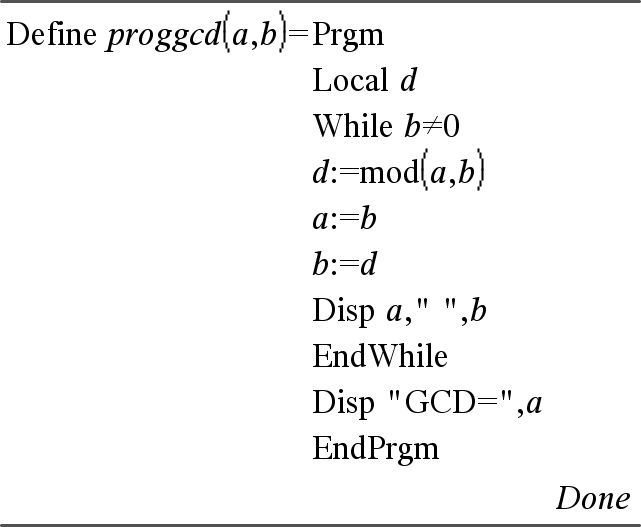
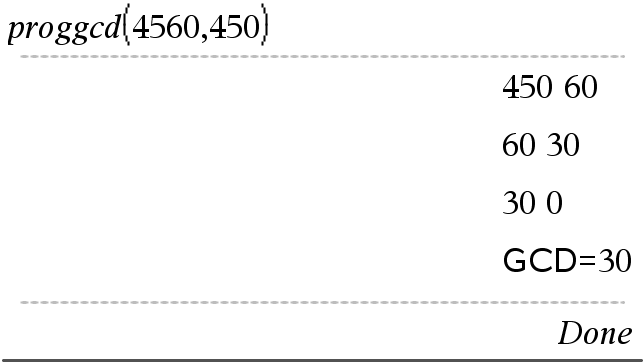
Template for creating a user-defined program. Must be used with the Define, Define LibPub, or Define LibPriv command. Block can be a single statement, a series of statements separated with the “:” character, or a series of statements on separate lines. Note for entering the example: For instructions on entering multi-line program and function definitions, refer to the Calculator section of your product guidebook. |
Calculate GCD and display intermediate results.
|
|
See Π (), here. |
|
|
|
|
|
Product (PI) |
See Π (), here. |
|
|
|
|
Catalog > |
|
|
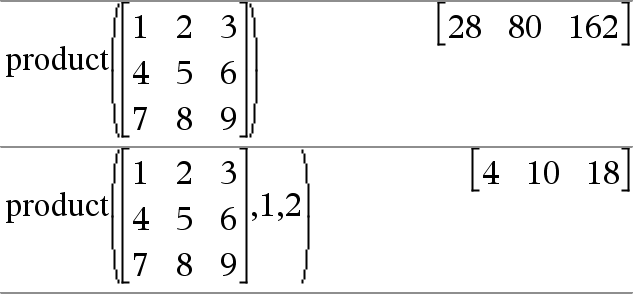
product(List[, Start[, End]]) ⇒ expression Returns the product of the elements contained in List. Start and End are optional. They specify a range of elements. |
|
|
product(Matrix1[, Start[, End]]) ⇒ matrix Returns a row vector containing the products of the elements in the columns of Matrix1. Start and end are optional. They specify a range of rows. Empty (void) elements are ignored. For more information on empty elements, see here. |
|
|
Catalog > |
|
|
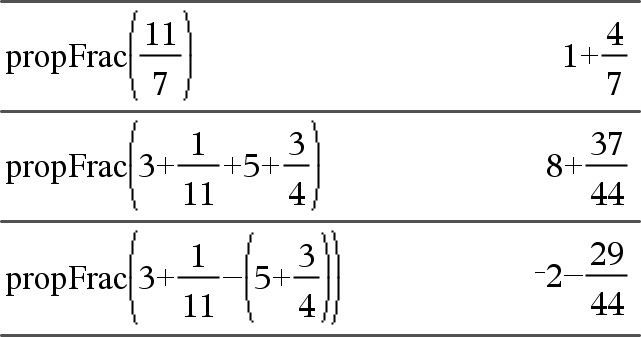
propFrac(Value1[, Var]) ⇒ value propFrac(rational_number) returns rational_number as the sum of an integer and a fraction having the same sign and a greater denominator magnitude than numerator magnitude. |
|
|
propFrac(rational_expression,Var) returns the sum of proper ratios and a polynomial with respect to Var. The degree of Var in the denominator exceeds the degree of Var in the numerator in each proper ratio. Similar powers of Var are collected. The terms and their factors are sorted with Var as the main variable. If Var is omitted, a proper fraction expansion is done with respect to the most main variable. The coefficients of the polynomial part are then made proper with respect to their most main variable first and so on. |
|
|
You can use the propFrac() function to represent mixed fractions and demonstrate addition and subtraction of mixed fractions. |
|

