In this lesson you will investigate sequences by using the TI-89's features. You will also explore when a sequence converges by viewing the graph of a sequence and the table of associated values.
Defining a Sequence
A sequence is a function whose domain is restricted to the set of positive integers or, in some cases, the set of nonnegative integers. The numerical representation for a sequence is a list or table of values and the graphical representation is a set of discrete points. There are several TI-89 features that are useful in creating these representations.
Using the Sequence Command
The sequence command can be used to create a list of a finite number of terms from a sequence.
|
|||
|
|
|||
Finding the Terms of a Sequence
Find the first ten terms of the sequence defined by
![]() , where an represents the value of the nth term of the sequence. Recall that the symbol "!" represents the
, where an represents the value of the nth term of the sequence. Recall that the symbol "!" represents the
factorial of the preceding number.
![]()
![]()
The factorial of a whole number is the product of the series of consecutive whole numbers that begin with 1 and end with the number: 6! = 1x2x3x4x5x6. 0! is defined to be 1.
![]()
![]()
- Perform NewProb
-
Open the MATH menu by pressing


- Highlight 3:List
![]() is above
is above
![]()
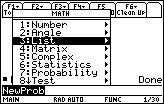
-
Open the List menu by pressing
 or
or

The first option in this menu is 1:seq(.
-
Paste this command to the Home Screen by pressing

- Complete the command seq(2^n/n!, n, 1, 10)
Press
![]()
![]() for the factorial symbol "!," which can also be found in the Catalog.
for the factorial symbol "!," which can also be found in the Catalog.
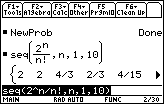
The command generates a list containing the first 10 terms in the sequence. Move the cursor into the History Area and scroll to the right to see the hidden part of the list.
21.1.1 Describe the behavior of list generated by
![]() as n gets large.
as n gets large.
Click here for the answer.
21.1.2 Take the limit of the sequence as n approaches
![]() by entering limit(2^n/n!, n,
by entering limit(2^n/n!, n,
![]() ).
).
Click here for the answer.
Defining Convergence
Because the limit of the expression that defines the sequence exists as n approaches infinity, the sequence is said to converge to the value of the limit. The sequence defined by
![]() converges to 0 as found in Question 21.1.2.
converges to 0 as found in Question 21.1.2.
If the limit grows without bound or the values jump around or oscillate and do not approach a single value, the sequence is divergent. A sequence may oscillate and converge if the oscillations become small and the values approach a single value.
Graphing Sequences
A graph of the sequence illustrates convergence.
|
|||
|
|
|||
-
Select Sequence Graphing mode by pressing

 to open the Graph mode dialog box and highlighting 4:Sequence
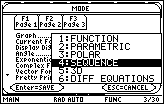
-
Save the setting by pressing
 twice
twice
- Enter the expression 2^n/n! in the Y= Editor
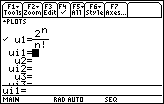
- Enter the Window values shown below
A description of the new parameters is given in the first column.
| Beginning value of n | nmin = 1 | xmin = 0 | ymin = -1 |
| Ending value of n | nmax = 10 | xmax = 11 | ymax = 3 |
| Where the plot starts | plotStrt = 1 | xscl = 1 | yscl = 1 |
| The increase in n from one point to the next | plotStep = 1 |
-
Display the graph of the sequence by pressing


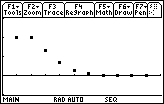
TRACE the terms of the sequence.
21.1.3 What feature of the graph indicates that the sequence converges?
Click here for the answer.
Creating a Table of Values
A sequence that is defined in the Y= Editor can be displayed in a table.
-
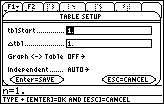
Open the Table Setup dialog box by pressing

 and set both tblStart and
 tbl to 1
-
Be sure to press
 in order to save the settings when you exit the dialog box
- Use the cursor movement keys to scroll down the table
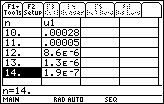
As you scroll down the table the values of u1 get smaller and smaller, which is numerical evidence that the sequence converges to zero.
21.1.4 Does the sequence
![]() converge? Provide graphical, numerical and analytical evidence for your conclusion.
converge? Provide graphical, numerical and analytical evidence for your conclusion.
Click here for the answer.