In Lesson 3.2 you looked at the number of people infected each day and found an equation that fit the data. In this lesson you will use the TI-89 to compute and graph the change in the number of infected people each day. That is, you will look at how the number of people infected is changing from one day to the next.
We have been using the number of infected people as the y-values in our graph, so the change in the number of infected people will be named
![]() y, which is read "delta y." The change in y is closely related to the concept of
y, which is read "delta y." The change in y is closely related to the concept of
derivative in calculus.
![]()
![]()
The derivative of a function is an expression that represents the instantaneous rate of change of the value of the function relative to changes in the input variable.
![]()
![]()
|
|||
|
|
|||
-
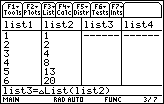
Return to the Stats/List Editor to compute the values of
 y
y
Compute
![]() y
y
If list1 and list2 can't be seen in the list editor, use the cursor movement keys to scroll to the left until they appear.
You will store the values of
![]() y, the change in the number of infected people from one day to the next, in list3 by defining list3 as
y, the change in the number of infected people from one day to the next, in list3 by defining list3 as
![]() List(list2).
List(list2).
Define List3 to be the Differences in List2
- Move the cursor until the heading "list3" is highlighted
-
With the heading highlighted, display the "List" menu by pressing


When the heading is highlighted you can enter a command for the entire list.
Get the
![]() List( command
List( command
-
Open the Ops (Operations) submenu by pressing

-
Paste the
 List( command to the Stats/List Editor Edit Line by pressing

Get the variable "list2"
-
Display the variable list by pressing
 [1: Names]
- Highlight "list2" by using the cursor movement keys
-
Paste list2 to the Edit Line by pressing

-
Press
.gif) to complete the command
to complete the command
-
Execute the command by pressing


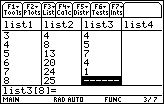
The changes in list2 are stored in list3. The first element in list3 is the difference between the second and first elements in list2. The second element in list3 is the difference between the third and second elements of list2. For this reason the values of
![]() y are also called differences.
y are also called differences.
Create a Scatter Plot of the Differences
-
Scroll to the bottom of list3 by using


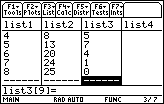
There is no eighth element in list 3 because there is no ninth element in list2 to use in computing a difference. In order to create a scatter plot of the differences, list 3 must have the same number of elements as list1 and list2.
Make each list have the same number of elements.
- Enter 0 for the eighth element of list3

-
Highlight Plot 2 in the Plot Setup screen by pressing


-
Open the "Define Plot 2" dialog box by pressing

The Plot type of Plot 2 should be "Scatter."
Select the Mark Type
To make the points for the differences different from the points for the number of people infected, let squares mark the points of the scatter plot of the differences.
-
Move down to the "Mark" line by using

-
Open the "Mark" submenu by pressing

-
Highlight "Square" by using

-
Save this selection to the Define dialog box by pressing


Designate the Lists for x and for
![]() y
y
- Paste "list1" from the Var-Link menu to the line labeled "x" in the dialog box
- Paste "list3" from the Var-Link menu to the line labeled "y" in the dialog box
-
Save list3 and close the Define dialog box by pressing


-
Close the Plot Setup dialog box by pressing

-
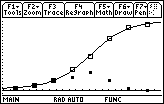
Display the difference graph together with the logistic curve by pressing
 [GRAPH]


The daily differences, as shown with square points, form a bell shaped curve.
The Relationship Between y and
![]() y
y
There are two significant relationships between the graph of y and the graph of
![]() y. Recall that y accumulated the total number of people infected and that
y. Recall that y accumulated the total number of people infected and that
![]() y
recorded the number of new cases each day. The first significant relationship between the graph y and the graph
y
recorded the number of new cases each day. The first significant relationship between the graph y and the graph
![]() y is that if
y is that if
![]() y (the change in y) is positive, then y is increasing.
y (the change in y) is positive, then y is increasing.
Secondly, the crest of the differences graph (the maximum value of
![]() y) occurs at the same position where the logistic regression curve changes from
y) occurs at the same position where the logistic regression curve changes from
concave upward
to
![]()
![]()
A curve is concave upward if the curve lies above the tangents.
![]()
![]()
concave downward
. That is, the maximum value of
![]()
![]()
A curve is concave downward if the curve lies below the tangents.
![]()
![]()
![]() y occurs where the graph of y has a
y occurs where the graph of y has a
point of inflection
. Both the maximum value of
![]()
![]()
A point where the graph of a function changes concavity is called an inflection point.
![]()
![]()
![]() y and the point of inflection on the graph of y occur on Day 5, the day that has the highest number of newly infected people and the day where the increase in subsequent values of y begins to slow.
y and the point of inflection on the graph of y occur on Day 5, the day that has the highest number of newly infected people and the day where the increase in subsequent values of y begins to slow.
3.3.1 The values of
![]() y are always positive. What does this tell you about the original logistic scatter plot? Click here for the answer.
y are always positive. What does this tell you about the original logistic scatter plot? Click here for the answer.
3.3.2 How is the peak of the difference graph related to the logistic curve? Click here for the answer.