Many traditional textbook problems begin with an equation and then produce the graph of the equation. However, in many real-world problems researchers first gather and graph data and then attempt to find an equation that fits the data. Technology facilitates this real-world approach to functions and graphs.
In this module you will learn to use the TI-89 to create a scatter plot of
logistic
data and then find a
![]()
![]()
Logistic functions are used to represent growth that has a limiting factor, such as food supplies, war, new diseases, etc. Logistic models are often used to model population growth or the spread of disease or rumor.
![]()
![]()
regression equation
that fits the data. You will use the TI-89 Statistics and List Editor, an application that is found in newer TI-89's or can be freely downloaded from TI's web site.
![]()
![]()
An equation that represents a set of data is called a regression equation, and it is used to estimate or predict values of a data set.
![]()
![]()
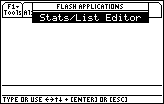
To find out if your calculator has the Statistics and List Editor application,
-
Display the Flash Apps menu by pressing


If one of the menu items is "Stats/List Editor," you are ready to proceed with this module.

If you do not have this feature, obtain the free upgrade from the TI Education web site at http://education.ti.com/educationportal/sites/US/productDetail/us_ti89ti.html. You will need a Graph Link cable and TI-Graph Link(89) software to install the upgrade from your computer to your calculator.
Lesson Index:
3.1 - Scatter plots
3.2 - Curve fitting
3.3 - Change in y
After completing this module, you should be able to do the following:
- Enter data in the TI-89 Stats/List Editor
- Make a scatter plot
- Find and graph a regression equation to fit a data set
- Calculate and graph the changes in y
- Understand and describe what the changes in y tell you about the original data