
Module 3 - Answers
 
Lesson 1
 
 Answer 1
 
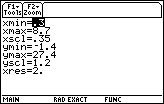
3.1.1   From the Window Editor, which is accessed by pressing [WINDOW], the boundaries of the viewing window are shown below.

 
Lesson 2
 
 Answer 1
 
3.2.1
 
Lesson 3
 
 Answer 1
 
3.3.1 If the differences are positive, the scatter plot of the original data is increasing.
 
 Answer 2
 
3.3.2 The peak of the difference graph corresponds to the inflection point of the logistic curve. A point of inflection on the curve of the function occurs on the same day where the curve of the differences has a maximum. This is where the increase in the values of the logistic curve begin to slow.
 
Self Test
 
 Answer 1
 
 
 Answer 2
 
 
 Answer 3
 
y = 1.0000x0.6661. The equations are almost the same. The regression equation is similar to y = x2/3. If both sides of this equation are cubed it yields Kepler's law.
 
 Answer 4
 
 
 Answer 5
 

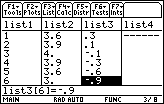
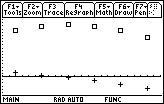
Because the List( command did not fill in the sixth value of list3, a value was added by hand.

The value of –.9 was chosen to continue the pattern in the differences.
 
 Answer 6
 
 
 Answer 7
 
The root of the difference graph corresponds roughly to the peak of the original graph. The differences are positive to the left of the root and the original data is increasing. The differences are negative to the right of the root and the original data is decreasing.
 

  ©Copyright 2007 All rights reserved. | Trademarks | Privacy Policy | Link Policy