You know how to find the areas of regular geometric objects such as rectangles and triangles, but how would you find the area of a region when some of the boundaries are curves? In this lesson you will approximate the area of a region that is bounded by a curve by using rectangles whose heights are determined by the y-coordinates of points on the curve.
Consider the area of the shaded region below, that is bounded by the graph of f(x) = x2 and the x-axis between x = 0 and x = 1. How would you find its area?
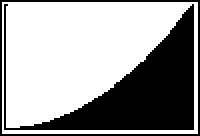
Getting a First Approximation
You may approximate the area under the curve by finding the areas of rectangles. Adding the areas of the four rectangles shown below approximates the area under the curve. The rectangles are called right-hand rectangles because the upper-right-hand corner of each lies on the graph of f(x) = x2.
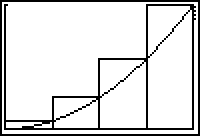
Finding the Width of Each Rectangle
The rectangles have equal widths along the x-axis that can be found by dividing the length of the interval by the number of rectangles. Using four rectangles over the interval [0, 1], the width of each rectangle shown is
![]() .
.
The x-coordinate of each right-hand endpoint is found by repeatedly adding the fixed width,
![]() , to the beginning point of the interval x = 0. In the example under discussion the four right-hand endpoints are
, to the beginning point of the interval x = 0. In the example under discussion the four right-hand endpoints are
![]() and 1.
and 1.
Finding the Area
Because the upper-right-hand corner of each rectangle is on the curve, the heights are found by evaluating the function at the right-hand x-coordinate of each of the four rectangles. For example, the x-coordinate at the right-hand edge of the third rectangle is
![]() so the height of the third rectangle is
so the height of the third rectangle is
![]() .
.
The area of each rectangle is found by multiplying the rectangle's width by the corresponding height. The total area under the curve is approximated by the sum of the areas of all the rectangles.
17.1.1 Approximate the area under the curve f(x) = x2 between x = 0 and x = 1 using four right-hand rectangles by completing the table below. Enter the right-hand x-coordinate and the corresponding y-coordinate for each rectangle, find each rectangle's width and height, and enter its area.
| Rectangle | x-coordinate |
Height (y-coordinate) |
Width | Area |
| 1 | ||||
| 2 | ||||
| 3 | ||||
| 4 | ||||
| Total |
Click here for the answer.
Finding a Better Approximation
To find a better approximation you can subdivide the region into more rectangles. So it is instructive to find a general procedure using an unspecified number of rectangles. The following table shows how to find the sum of n rectangular areas to approximate the area of a region bounded above by y = f(x) and below by the x-axis between x = a and x = b.
Using n Rectangles
The width of each of the n rectangles is given by
![]() and each right-hand x-coordinate is found by adding multiples of w to a, the left endpoint of the interval. The y-coordinate at the upper-right-hand corner of the rectangle (the height) is found by evaluating the function at the corresponding x-value.
and each right-hand x-coordinate is found by adding multiples of w to a, the left endpoint of the interval. The y-coordinate at the upper-right-hand corner of the rectangle (the height) is found by evaluating the function at the corresponding x-value.
Study the table carefully. It will help you understand how to define expressions for the area of a general rectangle and for the sum of the rectangular areas.
| Rectangle | x-coordinate |
Height y-coordinate |
Width | Area |
| 1 | a + w | f(a + w) | w | f(a + w) * w |
| 2 | a + 2w | f(a + 2w) | w | f(a + 2w) * w |
| 3 | a + 3w | f(a + 3w) | w | f(a + 3w) * w |
| ... | ... | ... | ... | ... |
| k | a + kw | f(a + kw) | w | f(a + kw) * w |
| ... | ... | ... | ... | ... |
| n | a + nw | f(a + nw) | w | f(a + nw) * w |
| Total |
|
Creating the Right-Hand Area Function
As shown in the previous table, each right-hand x-coordinate has the form a + kw, where
k = 1, 2, 3, ..., n.
The height of the corresponding rectangle has the form f(a + kw), and the area of the region is approximated by adding the areas of the rectangles, which is expressed as
The TI-83 Sum and Sequence commands will be used to define a new function that will compute the sum of the areas of the right-hand rectangles. This new function will return the total area of the right-hand rectangles that approximate the area under the curve defined as Y1 in the Y= editor.
The Seq command creates a sequence of terms that may then be added by using the Sum feature. The terms created by the Seq command will be the areas of the rectangles.
The function stored in Y1 will be used to determine the height of each rectangle. The x-value used to evaluate the function has the form a + kw, where a is the left-hand boundary, w is the width of each rectangle, and k denotes specific rectangles as counted from left to right.
|
|||
|
|
|||
The area of each rectangle is determined by its height (Y1 evaluated at a + kw) multiplied by its width (w). Because you will later use the same command to find the sum of the areas of more rectangles having different characteristics, the command used to calculate the sum of all the rectangles should be entered using general terms for the values of a, k, w, and n, as described below. The resultant command, which is equivalent to
![]() , will be
, will be
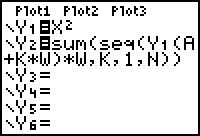
- Enter Y1 = X2.
-
Enter the Sum command in Y2 by pressing
 [LIST]


 .
.
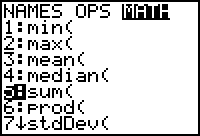
-
Enter the Seq command by pressing
 [LIST]

 .
.
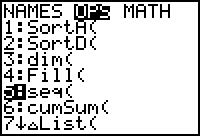
-
Complete the command Y2 = sum(seq(Y1(A+K*W)*W,K,1,N)).
Recall that Y1 is found in the VARS Y-VARS Function menu.
When you have entered the functions in Y1 and Y2, the Y= editor should look like the screen shown below.
Storing Specific Values
Return to the Home screen to store the values for A, B, N, and W.
First store the values for A and B, the endpoints of the interval on the x-axis, and the value for N, the number of rectangles.
-
Store 0 in A by pressing


 A
A
 . "A" is above
 .
.
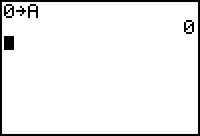
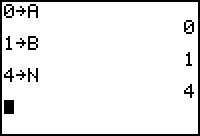
In a similar fashion store the values for B and N.
- Store 1 in B.
- Store 4 in N.
-
Define W by entering the command (B - A)/N

 W.
W.
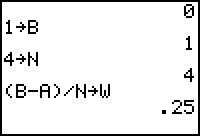
- Display the sum of the four right-hand rectangles by entering Y2 on the Home screen.
Because all the letters contained in the expression that defines Y2 have stored values, the TI-83 returns the expression evaluated with those values.
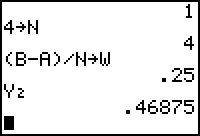
This is the same total area you found in the table using the four rectangles.
Using more Rectangles
When more rectangles are used to approximate the area under the curve, the approximation is a better estimation of the true area. Because you used letters instead of specific values when defining Y2, you can use the function in Y2 to approximate the area when the region is divided into more rectangles by simply changing the values stored in the letters.
Evaluate the sum for ten rectangles.
- Store 10 in N.
-
Redefine W by recalling and executing the command
 by pressing
 [ENTRY] three times.
-
Evaluate the new sum by entering Y2 on the Home screen again and pressing
 .
.
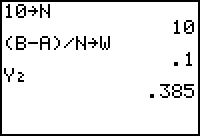
The sum of the ten right-hand rectangles is 0.385 square units.
17.1.2 Use the function in Y2 to get even better approximations of the area of this region using 50 rectangles and using 100 rectangles.
Click here for the answer.
Converging Sums
If we continue to evaluate Y2 for larger values of N, the sums will appear to converge to a limiting value.
17.1.3 Estimate the limit of Y2 as N approaches
![]() by using larger and larger values of N. Click here for the answer.
by using larger and larger values of N. Click here for the answer.
The exact area under the curve f(x) = x2 above the x-axis over the interval [0,1] is 1/3 square unit, which is the value of the limit.
Do not clear the Y= editor of the functions you defined in this lesson so that they may be used in Lesson 17.2.