In Lesson 10.1 and Lesson 10.2 you investigated the derivative of a function at a single point. The derivative was defined to be the slope of the tangent line at that point. In this lesson you will use the derivative feature in the Graph screen's CALCULATE menu to find the derivative at a point on a curve. You will then download and use a program named TANIMATE to illustrate derivatives at several points along a curve. This will help illustrate the concept of the derivative as a function.
Several notations are used to denote the derivative of a function. One commonly used notation is dy/dx, which is derived from the definition of the derivative as the limit of the difference of the y-values divided by the difference of the x-values.
The dy/dx Feature
The TI-83 has a feature that allows you to find the approximate value of the derivative of a function at a given point on the graph of the function.
Find the derivative of y = x2 at x = 1 using the dy/dx feature by following the procedure below.
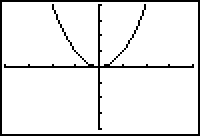
- Graph Y1 = X2 in a [-4, 4, 1] x [-4, 4, 1] window.
-
Open the Graph screen's CALCULATE menu by pressing
 [CALC].
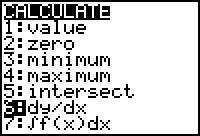
- Select 6:dy/dx.
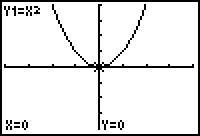
-
Enter the x-coordinate of the point of tangency (x = 1) by pressing
 .
.
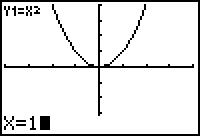
-
Execute the command by pressing
 .
.
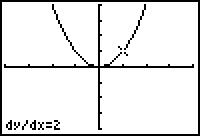
The approximate value of the derivative of y = x2 at x = 1 is 2, as shown at the bottom of the screen.
10.3.1 Compute the derivative at x = -2, -1, 0, 1, 2. Click here for the answers.
Plotting the Derivative versus the x-values
You could find the derivative at many more points using the dy/dx (derivative) command and create a table of values of the derivative at given x-values. The corresponding points could then be displayed as a scatter plot. This would be tedious, but the program tanimate can be used to automate this process.
The tanimate Program
The program tanimate displays an animated sequence of tangent lines for a given function. It also plots points representing the slopes of those tangent lines at selected x-values. Because the slope of a tangent line is the derivative of the function at that point, the program is actually plotting the values of the derivatives that correspond to specific x-values.
Downloading the Program to Your Computer
- Click (or Right-Click) here to download tanimate to your computer.
- Choose to save the file.
- Save the file on your local hard disk in a folder that you can access later.
Transferring the Program to the TI-83
Click here to get information about how to obtain the needed cable and to review the procedure to transfer the program from your computer to your calculator.
- Send the tanimate program from your computer to your TI-83.
Animating Tangent Lines
The program tanimate requires that you store the desired function into Y1 in the Y= editor and then graph the function in a selected viewing window.
- Graph Y1 = X2 in a [-4, 4, 1] x [-4, 4, 1] window.
- Return to the Home screen.
Running tanimate
-
Open the program menu by pressing
 .
.

-
Select TANIMATE and press
 .
.
The command "prgmTANIMATE" should be pasted to the Home screen.

-
Execute the program by pressing
 .
.
The function y = x2 will be graphed again and the tanimate program's Main menu should appear.
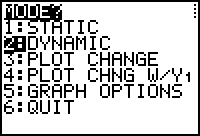
- Select 2:DYNAMIC.
The next menu is used to set the sampling rate, which determines the number of points that will be used to create and display the tangent lines.
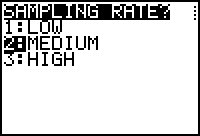
- Select 2:MEDIUM.
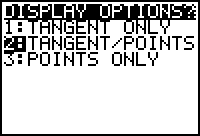
Now you should see the DISPLAY OPTIONS menu.
-
Select 2:TANGENT/POINTS.
This selection will later display tangent lines and points representing the slopes of the tangent lines.
Setting the Left Endpoint
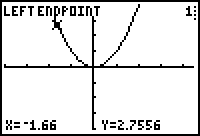
Now you should see the graph and a prompt for the left endpoint. Tangent lines will be drawn beginning with the x-value that you set as the left endpoint, and this value must be within the current window's coordinates.
- Move the cursor to the left endpoint of x = -1.66 with the arrow keys.
-
Press
 to select this left endpoint.
Setting the Right Endpoint
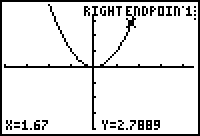
Next you should see a prompt for the right endpoint. This value determines the x-coordinate where the last tangent line will be drawn. Again, this value must be within the current window's coordinates.
- Move the cursor to the right endpoint of x = 1.67.
-
Select this right endpoint by pressing
 .
.
Viewing Animated Tangent Lines and Plotted Slopes
You should see an animation of tangent lines. As each tangent line is graphed, a corresponding point that represents the derivative of the function at that point is plotted. The x-coordinate of the plotted point is equal to the x-coordinate of the point of tangency, and the y-coordinate of the plotted point is the slope of the corresponding tangent line, i.e., the derivative at that point.
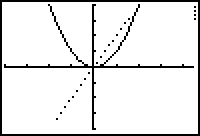
The screen above shows the graph at the end of the program.
-
Press
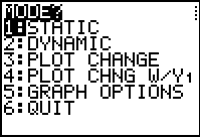
 to return to the program's Main menu.
Finding Derivatives at Several Points
The tanimate program can now display the value of the derivative (the slope of the tangent line) at specific points. In general, these values will be approximate values.
- Select 4:PLOT CHNG W/Y1 (Plot Change With Y1) from the Main menu.
-
Display the values of the derivative at several points by pressing
 and noting the x and y values at the bottom of the screen.
For example, the derivative of f(x) = x2 at x = -0.94 is -1.88, as shown by the coordinates at the bottom of the screen below.
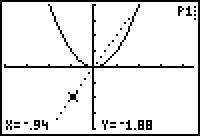
10.3.2 Find the derivative when x = 1.22 and interpret its value. Click here for the answer.
Exiting the Program
-
Return to the program's Main menu by pressing
 twice.
- Exit the program by selecting 6:QUIT.
The Derivative as a Function
The set of points plotted by tanimate represents the slopes of the corresponding tangent lines. These points represent a function whose y-values give the derivative of the original function at each point.
The points on the graph of the derivative of f(x) = x2 appear to lie on a line. Instead of using difference quotients and/or limits to compute the derivative at various points, if the equation for that line is known, then that equation can be used to find the value of the derivative at any x-value.
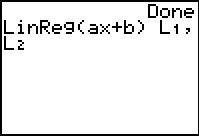
The x- and y-coordinates of the points on the graph of the derivative were stored in L1 and L2 by the program tanimate. Linear regression can be used to find the equation of the line that contains these points and that equation can then be used to find derivatives of the function at other x-values.
- Paste the regression command "LinReg(ax+b)" to the Home screen from the STAT CALC menu.
- Complete the command LinReg(ax+b) L1,L2.
-
Execute the command by pressing
 .
.
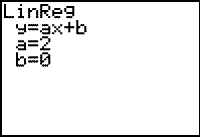
The derivative of f(x) = x2 is the function y = 2x.
An Alternate Notation for a Derivative Function
The notation f'(x) is another notation that is used to represent the derivative of f(x). For example, we have just shown that if f(x) = x2, then f'(x) = 2x. f'(x) is read "f prime of x."
10.3.3 Illustrate the derivative of f(x) = 3x2 + 4x using the tanimate program and then use regression to find the derivative function. When prompted, select the options given below.
Mode: 2:DYNAMIC
Sampling Rate: 2:MEDIUM
Display Options: 2;TANGENT/POINTS
You may exit the program after it displays the animated tangent lines by selecting 6:QUIT. The data points for the derivative values are stored in L1 and L2.
Click here for the answer.