In Lesson 10.1 you found an equation of the line tangent to a function at a given point. In this lesson you will explore the appearance of the graphs of the function and its tangent line as you zoom in around the point.
A function is locally linear around a point if it looks like a line in a small region around the point. You can often determine if a function has local linearity at a point by viewing the graph of the function in a small window centered at that point. You can not be sure how small your window should be to make the determination. Also the limitations of technology can cause graphs to be misrepresented in very small windows.
Zooming In
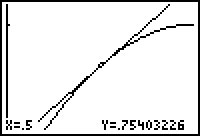
Determine if the function f(x) = 2x - x2 is locally linear at (0.5, 0.75) by zooming in around that point.
- Display the graphs of Y1 = 2X - X2 and Y2 = (X - 0.5) + 0.75 in a [-1, 3, 1] x [-1, 2, 1] window.
- Select "2:Zoom In" from the Zoom menu.
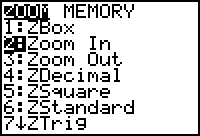
The TI-83 prompts you for the zoom center.
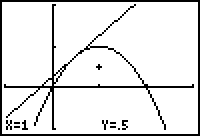
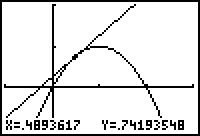
- Move the cursor as close as you can to (0.5, 0.75) by using the arrow keys.
-
Zoom in on the point you have selected by pressing
 .
.
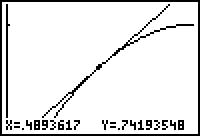
The graphs are redrawn in a smaller window whose center is approximately (0.5, 0.75).
Zooming in Again
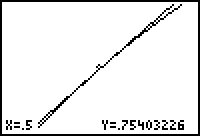
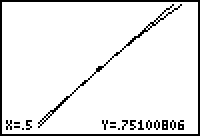
The local linearity of the function can be better illustrated by zooming in repeatedly.
- The calculator is still in the "Zoom In" mode, so move the cursor as close as you can to (0.5, 0.75).
-
Zoom in again by pressing

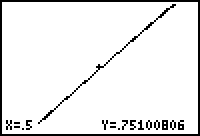
- Repeat the "zoom in" process once more.
|
|
|
|
In the last window the graphs of the function and the tangent line appear to coincide. That is, the curve appears to be linear on a small scale.
Local Linearity and Point Differentiability
If a curve would look linear around a point in a small enough window, it is said to be locally linear near that point. If a curve is locally linear near a point, the curve is
differentiable
at the point.
![]()
![]()
A function is differentiable at a point if its derivative exits there.
![]()
![]()
Determining Differentiability Graphically
One of the following functions is differentiable at x = 0 and the other is not:
![]()
Display the graphs of the functions to illustrate which one is differentiable at x = 0.
-
Set Y1 = abs(X)+1.
The absolute value command is the first item in the catalog, which is accessed by pressing [CATALOG]. The absolute value command can also be found in the NUM submenu of the MATH menu.
-
Set

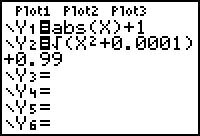
- Display the graphs in a Decimal window by selecting 4:ZDecimal from the Zoom menu.
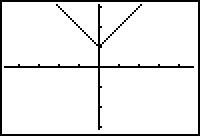
The graphs appear to coincide in this viewing window. You may want to use Trace to convince yourself that both graphs are present.
|
|||
|
|
|||
Setting the Zoom Factors
Zoom in around the point (0,1) to see which graph is locally linear there. You may want a higher level of magnification to make the process faster. This can be accomplished by changing the Zoom factors.
-
Display the Zoom Memory menu by pressing

 .
.
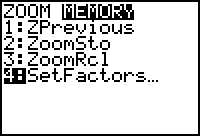
- Select 4:SetFactors.
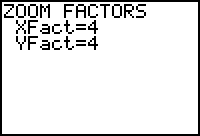
- Change XFact and YFact from 4 to 10.
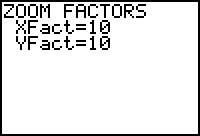
-
Save the changes and return to the graph by pressing
 .
.
Zooming In Using the New Factors
- Repeatedly zoom in on the point (0,1) by using the procedure described earlier.
At first the graphs will appear to be identical, but as you continue to zoom in, you should see a difference.
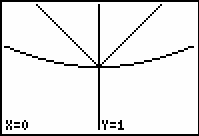
|
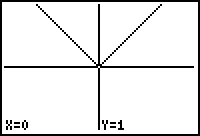
|
| After zooming in 3 times | After zooming in 5 times |
10.2.1 Based on the graphs above, which function is differentiable at x = 0 and which is not? Click here for the answer.
|
|||
|
|
|||