In this lesson you will examine a rational function with a nonlinear asymptote.
The asymptotes discussed in the previous lessons were all linear. Some asymptotes are nonlinear, as shown in the example below.
Consider the rational function
![]() . Long division can be used to rewrite the rational function as a polynomial plus a proper fraction.
. Long division can be used to rewrite the rational function as a polynomial plus a proper fraction.
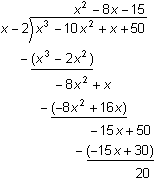
The same procedure used in Lesson 7.3 for an oblique linear asymptote can be used to identify characteristics of the graph of any rational function.
7.4.1 Discuss what the results of the long division indicate about the graph of
![]() and describe its graph. Click here for the answer.
and describe its graph. Click here for the answer.
Graphical support for the answer to Question 7.4.1 may be found by graphing the function in a large window and in a smaller window near x = 2.
The Wide View
-
Enter
 and Y2 = x2 - 8x - 15 in the Y= editor.
- Set the Window values to [-50, 50, 10] x [-2500, 2500, 500].
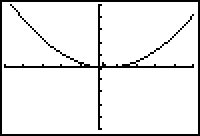
The graph of
![]() resembles the graph of the parabola y = x2 - 8x - 15 in the large viewing window. The curve y = x2 - 8x - 15 is a parabolic asymptote for the rational function.
resembles the graph of the parabola y = x2 - 8x - 15 in the large viewing window. The curve y = x2 - 8x - 15 is a parabolic asymptote for the rational function.
The Narrow View
-
Replace Y2 with the function
 .
.
- Set the Window values to [0, 4, 1] x [-500, 500, 50].
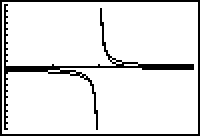
The graph of
![]() resembles the graph of
resembles the graph of
![]() in the smaller window.
in the smaller window.
A Medium View
Both the vertical and parabolic asymptotic behavior of
![]() may be seen in a medium sized window.
may be seen in a medium sized window.
- Reset Y2 = x2 - 8x - 15
Changing the graphing style of Y2 = x2 - 8x - 15 to "dot" will make the difference between the graph of the function and its parabolic asymptote clearer.
- Move the cursor to the symbol shown left of Y2 in the Y= editor by using the left arrow key.
-
Display the symbol for "dot" style by pressing
 six times.
Each time you press you will see a symbol representing a different graphing style.
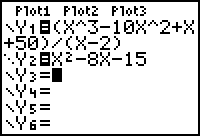
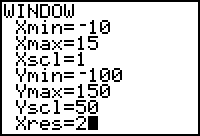
- Set the Window values to [-10, 15, 1] x [-100, 150, 50].
- Change the value of Xres to 2 in the Window editor.
|
|||
|
|
|||
-
Graph the rational function and the "dotted" parabolic asymptote by pressing
 .
.
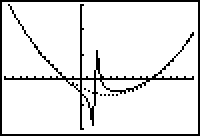
The screen shows that the rational function resembles the parabolic asymptote when x is not near 2 but it differs from the parabolic asymptote close to 2. It also implies that there is a vertical asymptote at x = 2.
Displaying a Complete Graph
As you have seen, the choice of viewing window can dramatically affect the appearance of a function, and different windows should be used to illustrate different features. The best graph is one where all significant features of a function are displayed or implied. Such a graph is called a complete graph. Two or more windows are often needed to illustrate a complete graph.