In this lesson you will investigate a
rational function that has both vertical and horizontal asymptotes. The asymptotes will be displayed graphically, then tables and analytic methods will be used to describe the behavior of the function near its asymptotes.
![]()
![]()
A rational function f is a function that can be written in the form
![]() , where p and q are polynomials and
, where p and q are polynomials and
![]() .
.
![]()
![]()
Conceptually, an asymptote is a line or a curve that the graph of a function approaches. Vertical asymptotes occur where function value magnitudes grow larger as x approaches a fixed number. Horizontal asymptotes occur when a function approaches a horizontal line as x approaches positive or negative infinity. Both types of asymptotes are discussed in this lesson and their formal definitions are given below.
Vertical Asymptote Definition
A function has a vertical asymptote at x = a if as the input values approach a from at least one side, the magnitude of the output increases without bound. That is, the line x = a is a vertical asymptote if
The diagram below illustrates the vertical asymptote of the function
![]() . Notice the function approaches negative infinity as x approaches 0 from the left and that it approaches positive infinity as x approaches 0 from the right.
. Notice the function approaches negative infinity as x approaches 0 from the left and that it approaches positive infinity as x approaches 0 from the right.
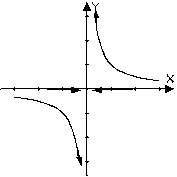
Horizontal Asymptote Definition
A horizontal asymptote is a horizontal line that the graph of a function approaches as the magnitude of the input increases without bound in either a positive or negative direction. That is, the line y = k is a horizontal asymptote of f(x) if
A function may cross a horizontal asymptote for finite values of the input.
The function
![]() has a horizontal asymptote y = 0, as shown below.
has a horizontal asymptote y = 0, as shown below.
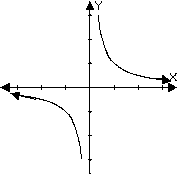
Comparing Vertical and Horizontal Asymptotes
A rational function is undefined at a vertical asymptote. The limits as
![]() or as
or as
![]() will be the same if the function has a horizontal asymptote.
will be the same if the function has a horizontal asymptote.
7.1.1 Graph the function
![]() in a [-20, 20, 5] x [-10, 10, 2] window. Use the graph to estimate the vertical and horizontal asymptotes and write their equations. Click here for the answer.
in a [-20, 20, 5] x [-10, 10, 2] window. Use the graph to estimate the vertical and horizontal asymptotes and write their equations. Click here for the answer.
|
|||
|
|
|||
Vertical Asymptotes from a Table of Values
A table of values of the function
![]() near the vertical asymptote x = 3 can be useful in illustrating the function's behavior near the asymptote.
near the vertical asymptote x = 3 can be useful in illustrating the function's behavior near the asymptote.
- Confirm that Y1 = (2x2 + 4x) / (x2 - x - 6) is in the Y= editor.
-
Display the Table Setup screen by pressing
 [TBLSET].
-
Enter 2.98 for TblStart and 0.01 for
 Tbl.
Tbl.
- Select "Auto" for both Indpnt and Depend.
-
Display the table by pressing
 [TABLE].
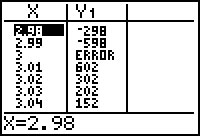
7.1.2 Describe the behavior of the function near the vertical asymptote x = 3. Click here for the answer.
Finding a Vertical Asymptote Analytically
Factoring the numerator and denominator of a rational function and simplifying the fraction can provide information about the function near a possible asymptote. For example,
![]() can be written as
can be written as
Because
![]() is the same as
is the same as
![]() except when x = -2, the expression
can be used in left and right-hand limits to determine the behavior of the function near x = 3.
except when x = -2, the expression
can be used in left and right-hand limits to determine the behavior of the function near x = 3.
The Left-Hand Limit
As x approaches 3 from the left the numerator of
![]() approaches 6 while the denominator approaches 0 through negative values. This means the fraction
approaches 6 while the denominator approaches 0 through negative values. This means the fraction
![]() will approach negative infinity.
will approach negative infinity.
The Right-Hand Limit
As x approaches 3 from the right the numerator of
![]() approaches 6 while the denominator approaches 0 through positive values. This means the fraction
approaches 6 while the denominator approaches 0 through positive values. This means the fraction
![]() will approach positive infinity.
will approach positive infinity.
Therefore, x = 3 is a vertical asymptote of
![]() .
.
Horizontal Asymptotes from a Table of Values
Make a table of values to show the behavior of the function
![]() as it approaches the horizontal asymptote y = 2 when x is large and positive and when x is negative and large in absolute value.
as it approaches the horizontal asymptote y = 2 when x is large and positive and when x is negative and large in absolute value.
-
Set TblStart = 10 and
 Tbl = 20 and then display the table.
-
Set TblStart = -10 and
 Tbl = -20 and then display the table.
-
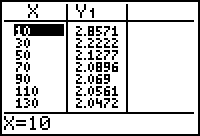
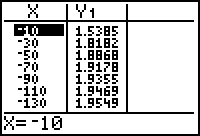


7.1.3 What do the two tables tell you about the behavior of the function
![]() as
as
![]() gets large? Click here for the answer.
gets large? Click here for the answer.
Finding a Horizontal Asymptote Analytically
As the magnitude of x gets large, the term 2x2 dominates the numerator and the term x2 dominates the denominator. The end behavior of the rational function
![]() resembles the rational function
resembles the rational function
![]() . We say that y = 2 is an end behavior model for
. We say that y = 2 is an end behavior model for
![]() . In other words, the line
. In other words, the line
y = 2 is the horizontal asymptote of
![]() .
.