In Lesson 5.2 you looked at the number of people who know a rumor each day and found an equation that fit the data. In this lesson you will use the TI-83 to compute and graph the change in the number of people who know the rumor each day.
We have been using the number of people who know a rumor as the y-values in our graph. The change in the number of people who know the rumor each day will be named
![]() y, which is read "delta y." The change in y,
y, which is read "delta y." The change in y,
![]() y, is closely related to the concept of a
y, is closely related to the concept of a
derivative.
![]()
![]()
The derivative of a function is an expression that represents the instantaneous rate of change of the value of the function relative to changes in the input variable.
![]()
![]()
On a given day, the change in the total number of people who know the rumor is equal to the number of new people who were told on that day.
![]() y and the
y and the
![]() List Command
List Command
![]() List is a command on the TI-83 that computes the differences between subsequent values of a list. It can generate the number of new people told each day,
List is a command on the TI-83 that computes the differences between subsequent values of a list. It can generate the number of new people told each day,
![]() y. The TI-83 can be instructed to automatically store the values of
y. The TI-83 can be instructed to automatically store the values of
![]() y into L3 by using
y into L3 by using
![]() List.
List.
Define L3 to be the Differences in L2
-
Return to the Stat/List editor by pressing

 .
.
-
If L3 is not in the third column of the Stat/List editor, press
 to return to the STAT menu and select 5:SetUpEditor to paste that command to the Home screen. Then press
 to execute the command, resetting the names in the editor, and return to the editor by pressing

 .
.
-
Clear list L3, if necessary, by moving the cursor on the heading "L3" and pressing

 .
.
- Move the cursor to the heading "L3" using the up arrow key.
-
With the heading highlighted, display the LIST menu by pressing
 [LIST].
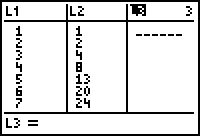
When the heading is highlighted you can enter a command for the entire list.
Entering The
![]() List( Command
List( Command
-
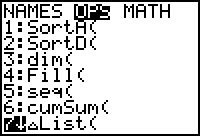
Open the Ops (Operations) submenu by pressing
 .
.
-
Paste the
 List( command by pressing
 .
.
-
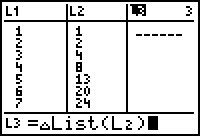
Complete the command L3 =
 List(L2) by pressing
 [L2]
[L2]
.gif) .
.
-
Execute the command by pressing
 .
.
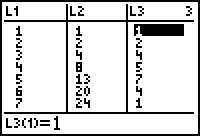
The differences in subsequent values of L2 are stored in L3.
- The first element in L3 is the difference between the second and first elements in L2.
- The second element in L3 is the difference between the third and second elements of L2.
For this reason the values of
![]() y are also called differences.
y are also called differences.
Create a Scatter Plot of the Differences
There is no eighth element in L3 because there is no ninth element in L2 to use in computing an eighth difference. In order to create a scatter plot of the differences, L3 must have the same number of elements as L1 and L2. The eighth number of L3 can be any number but it is usually better for the number to fit the pattern of values in L3.
-
Scroll to the bottom of L3 by using
 .
.
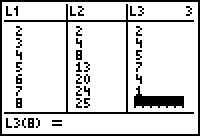
Make Each List Have the Same Number of Elements.
- Enter 0 for the eighth element of L3.
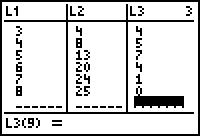
Graph the Scatter Plot of the Differences
-
Go to the STAT PLOT Setup menu by pressing
 [STAT PLOT].
-
Select Plot2 by pressing
 .
.
-
Select the values in the Setup menu shown below.
Notice the Xlist is L1, the Ylist is L3 and the Mark type is a "+" symbol. -
Display the difference graph together with the logistic curve by pressing
 .
.

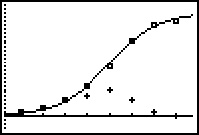
The daily differences, as shown with "plus" symbols, form a bell-shaped curve. The first three data points for the scatter plot of the differences can not be seen in this graph, but you can find them by Tracing Plot2.
The Relationship Between y and
![]() y
y
There are two significant relationships between the graph of y and the graph of
![]() y. Recall that y accumulated the total number of people who know the rumor and that
y. Recall that y accumulated the total number of people who know the rumor and that
![]() y recorded the number of new people told each day.
y recorded the number of new people told each day.
-
The first significant relationship between the graph y and the graph
 y is that if
 y (the change in y) is positive, then y is increasing.
-
Secondly, the crest of the differences graph (the maximum value of
 y) occurs at the same x-value where the logistic regression curve changes from
concave upward to

A curve is concave upward if the curve lies above its tangents. 

concave downward. This is where the maximum value of

A curve is concave downward if the curve lies below its tangents. 

 y occurs where the graph of y has a
point of inflection.

A point where the graph of a function changes concavity is called an inflection point. 

Both the maximum value of
![]() y and the point of inflection on the graph of y occur on Day 5, the day that has the highest number of new people who know the rumor and the day where the increase in subsequent values of y begins to slow.
y and the point of inflection on the graph of y occur on Day 5, the day that has the highest number of new people who know the rumor and the day where the increase in subsequent values of y begins to slow.
5.3.1 The values of
![]() y are always positive in a logistic model. What does this tell you about the original logistic scatter plot? Click here for the answer.
y are always positive in a logistic model. What does this tell you about the original logistic scatter plot? Click here for the answer.
5.3.2 How is the peak of the difference graph related to the logistic curve? Click here for the answer.