Module 5 - Answers
 
Lesson 1
 
 Answer 1
 
5.1.1

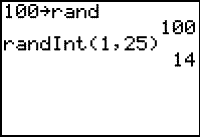
Student 14 would be the first student to know the rumor.
 
Lesson 2
 
 Answer 1
 
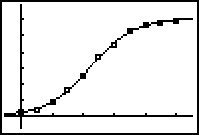
5.2.1 The model estimates that approximately 13.8 people knew the rumor on Day 5 and the data shows that 13 people knew the rumor on that day.
 
Lesson 3
 
 Answer 1
 
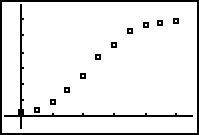
5.3.1 The y-values in the original logistic scatter plot are increasing.
 
 
 Answer 2
 
5.3.2 The x-coordinate of the peak of the difference graph is also the x-coordinate of the inflection point of the logistic curve. The inflection point is where the logistic curve changes concavity and where the change in output is greatest.
 
 
Self Test
 
 Answer 1


 Answer 2


 Answer 3


 Answer 4


 Answer 5
 

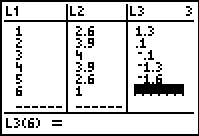
Add -2 to the end of the difference list in L3 to continue the pattern of differences and to make the size of L3 the same as L1 and L2.

 
 Answer 6
 

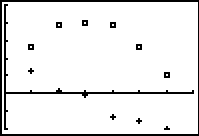
The root of the difference graph (3) corresponds to the maximum of the scatterplot of the original data. To the left of this root the differences are positive and the original scatterplot is increasing. To the right of the root the differences are negative and the original scatterplot is decreasing.


  ©Copyright 2007 All rights reserved. | Trademarks | Privacy Policy | Link Policy