Lesson 3.1 discussed two types of transformations: stretches and reflections. This lesson will introduce translations, a third type of transformation, and discuss the effects of combining several types of transformations.
Translations
A translation sends all points of a graph the same distance in the same direction.
Vertical Translations
A vertical translation, or vertical shift, moves every point on a graph up or down the same distance. Explore the effect of adding three to the absolute value function.
-
Enter Y1 = abs(x) and Y2 = abs(x) + 3 in the Y= editor.

-
Display the table of values by pressing
 [TABLE].
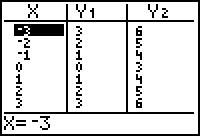
Notice that the values in Y2 are three more than the values in Y1.
-
Graph
 in thick style and
 in thin style in a Zoom Standard window.
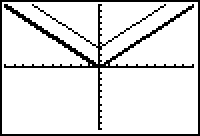
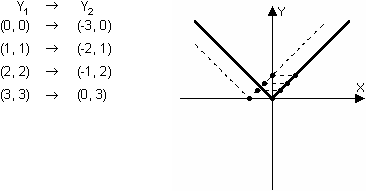
Vertical shift up 3
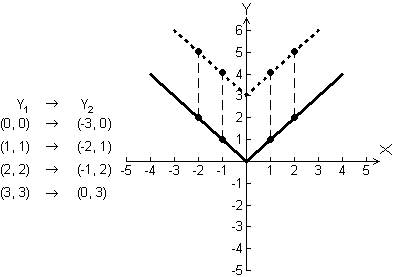
The transformed graph is a vertical shift of
![]() up 3 units. The table and diagram below illustrate the vertical shift of 3 units upward.
up 3 units. The table and diagram below illustrate the vertical shift of 3 units upward.
3.2.1 Display the graphs of
![]() and
and
![]() and describe the transformations. Click here for the answer.
and describe the transformations. Click here for the answer.
Horizontal Shifts
We have examined vertical transformations that were created by stretching or shrinking vertically, by reflecting across the x-axis, or by shifting upward or downward. In each case, we described how the transformed graph's y-values were related to the corresponding y-values of the original function.
We will now examine the effect of adding to (or subtracting from) the x-values before applying the function. Recall that when a constant was added to the y-values, the transformation was a vertical shift. It should seem reasonable to conclude that when you add a constant to the x-values, the transformation will be a horizontal shift.
Describing Horizontal Shifts
When describing a horizontal shift, it is helpful to see which x-values produce the same y-value. Display the function
![]() with the basic absolute value function and compare the x-values that produce a specific y-value.
with the basic absolute value function and compare the x-values that produce a specific y-value.
-
Enter Y2 = abs(X + 3)

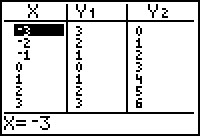
- Display the table of values for Y1 = abs(X) and Y2 = abs(X + 3).
-
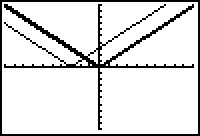
Graph
 in thick style and
 in thin style in a Zoom Standard window.
|
|
| Horizontal shift left 3 |
The fixed output of y = 0 was produced by x = 0 in Y1 and was produced by x = -3 in Y2.
![]() is a horizontal shift of
is a horizontal shift of
![]() left 3 units, which may be opposite to the direction you expected.
left 3 units, which may be opposite to the direction you expected.
3.2.2 Use your calculator to experiment and find the function that will shift
![]() horizontally to the right 3 units. Click here for the answer.
horizontally to the right 3 units. Click here for the answer.
Horizontal Stretches and Compressions
Just as multiplying a function by a constant stretches or shrinks the graph vertically, multiplying the x-value by a constant before applying the function will stretch or shrink the graph horizontally. In many functions like the absolute value function, the horizontal compression appears to be a vertical stretch.
-
Set
 and
and
 .
.
-
Examine the table of values of
 and
and
 for
for

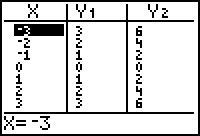
From the table it appears that the values of Y2 are twice that of the values of Y1. This is true because
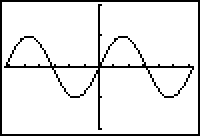
The graphs of y = sin x and y = sin 2x better illustrate the effect of multiplying x by a constant.
The Graph of y = sin x
-
Check that your calculator is in radian mode and set Y1 = sin(X) and display the graph in a
 window.
 is above
 , the power key.
Characteristics of the Sine Wave
The graph of y = sin x has the characteristics listed below.
The graph is periodic and has a period of 2
![]() . That is, the y-values repeat over x-intervals of length 2
. That is, the y-values repeat over x-intervals of length 2
![]() , or sin x = sin (x + 2
, or sin x = sin (x + 2
![]() ).
).
The graph has amplitude of 1. That is, the y-values rise to 1 unit above the centerline and fall to 1 unit below the centerline.
The domain of the sine function is the set of all real numbers.
The range of the sine function is
![]()
Special Points on y = sin x
It is often useful to identify the five special points on the sine wave whose x-values are
![]() and
and
![]() , as shown in the table and graph below.
, as shown in the table and graph below.
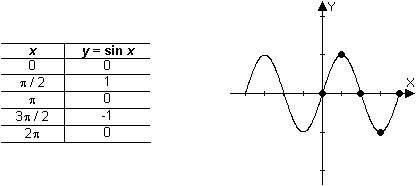
The Graph of y = sin 2x
Now display the graph of y = sin 2x and compare it to the graph of y = sin x.
- Set the style of the graph of Y1 = sin(X) to thick.
- Set Y2 = sin(2X)
-
Display both graphs in a [0, 2
 , 1] x [-2, 2, 1] window.

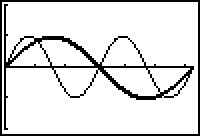
Notice that the graph of y = sin 2x is compressed horizontally and one period is completed in half the original period. The table and diagram below illustrate how the five special points of the basic sine wave are transformed.
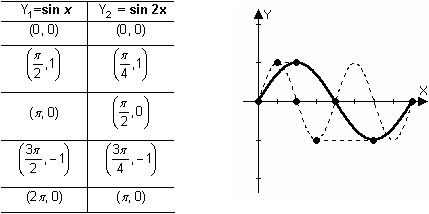
Notice that in Y2 the x-values that produce the same y-values are half those in Y1. That is, the graph is compressed horizontally by a factor of
 .
.
Combined Transformations
The function
![]() combines several transformations of the graph of
combines several transformations of the graph of
![]() . The graph of
. The graph of
![]() is the graph of the basic function
is the graph of the basic function
![]() that has been:
that has been:
- Reflected about the x-axis because a negative multiplies the basic function.
- Vertically stretched by a factor of 2 because basic function is multiplied by 2.
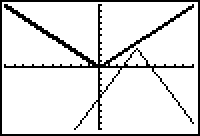
- Shifted right 4 because 4 is subtracted from x.
- Shifted upward 3 units because 3 is added to the basic function
|
|||
|
|
|||
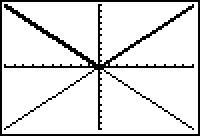
The graphs below illustrate the above sequence of combined transformations.
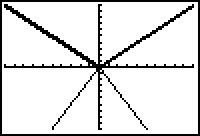
The graph is reflected across the x-axis.

|
|
| Reflected across the x-axis |
The graph is then stretched by a factor of 2.

|
|
| Stretched by a factor of 2 |
The graph is then translated right 4 units and up 3 units.

|
|
| Shifted right 4 units and up 3 units |
Recognizing the basic shape of a graph and then applying the indicated transformations will help you sketch the graph before displaying it with your calculator.
3.2.3 Describe the transformations in a correct order for the equation
![]() then sketch the graph with paper and pencil. Enter the equation in your calculator, graph it and compare it with your sketch. Click here for one correct answer.
then sketch the graph with paper and pencil. Enter the equation in your calculator, graph it and compare it with your sketch. Click here for one correct answer.
|
|||
|
|
|||
