In this lesson you will begin with the graph of the absolute value function,
![]() , and then explore how to stretch and shrink the graph vertically, reflect the graph across the x-axis, and shift the graph vertically and horizontally. Stretches, shifts and reflections of a graph are called transformations.
, and then explore how to stretch and shrink the graph vertically, reflect the graph across the x-axis, and shift the graph vertically and horizontally. Stretches, shifts and reflections of a graph are called transformations.
The Absolute Value Function
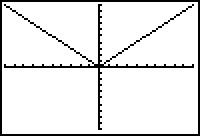
Begin the exploration of transformations of graphs by displaying the graph of the absolute value function,
![]() .
.
- Open the STAT PLOT menu and turn off all active plots.
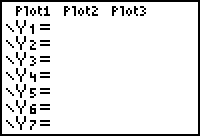
- Open the Y= editor, clear any old functions that may be in the editor and place the cursor by Y1.
-
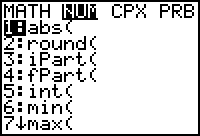
Open the MATH NUM menu by pressing

 .
.
-
Press
 to paste the absolute value command, abs, in Y1.
-
Complete the command Y1=abs(x) by pressing

.gif) .
.
-
Display the graph in a Zoom Standard window by pressing

 .
.

Stretch and Shrink Vertically
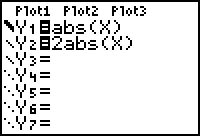
Explore the effect of multiplying the absolute value function by 2 and compare it with the basic absolute value graph. Make the graph of Y1 = abs(X) thicker to distinguish it from the transformed graph.
Open the Y= editor and change the line style of Y1 = abs(X) to thick.
- Place the cursor in the Y1 function.
- Press the left arrow until the cursor is past the = sign.
-
Press
 to select the thick style.
Pressing repeatedly will rotate through the seven available styles.
-
Return to the editor line by pressing

 when you have selected the style.
-
Enter Y2 = 2abs(X)
Recall that abs( is the first item in the MATH NUM menu.
View the table of values for the two functions.
-
Open the TABLE SETUP menu by pressing
 [TBLSET], which is above
 .
.
-
Set TblStart to -3 and
 Tbl to 1.
- Indpnt and Depend should both be set to AUTO.
-
Display the table of values for X, Y1 and Y2 by pressing
 [TABLE].
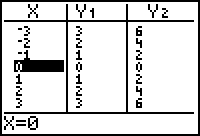
Notice that each Y2 value is 2 times the corresponding Y1 value.
-
Display the graphs by pressing
 .
.
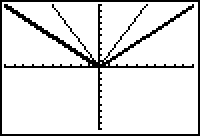
Vertical Stretch by a factor of 2
The Stretch Factor
The table below shows points on the graph of Y1 and the corresponding points on Y2. The illustration shows the relative position of corresponding points.
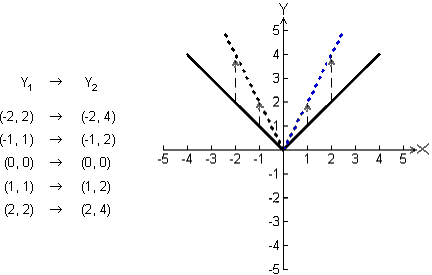
The graph of
![]() is a vertical stretch of the graph of
is a vertical stretch of the graph of
![]() and the stretch factor is 2. Notice that the x-intercept is not stretched because 2(0) = 0.
and the stretch factor is 2. Notice that the x-intercept is not stretched because 2(0) = 0.
3.1.1 Graph
![]() and
and
![]() in a Zoom Standard window and describe the resulting transformations. Click here for the answer.
in a Zoom Standard window and describe the resulting transformations. Click here for the answer.
Reflections
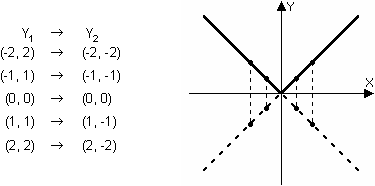
Another interesting transformation is a reflection, which is a mirror image.
The reflection of a point across a line sends the point p onto the point q, where the reflecting line is the perpendicular bisector of the line segment between p and q.

Reflecting a graph across a line reflects each point of the graph across the line.

Reflecting Across the x-Axis
Explore the effect of multiplying a function by -1.
- Enter Y2= -abs(X) in the Y= editor.
-
Display the table of values for X, Y1, and Y2 by pressing
 [TABLE].
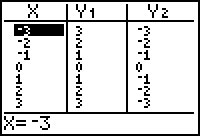
Each Y2 value is the negative of the corresponding Y1 value.
3.1.2 Graph
![]() and
and
![]() in a Zoom Standard window and describe the transformation. Click here for the answer.
in a Zoom Standard window and describe the transformation. Click here for the answer.