The slope and y-intercept of the best-fit line are helpful in understanding a set of data and the relationship that exists between the quantities in the set. This lesson explores the meaning of slope and y-intercept in the context of the car-value problem that was introduced in Lesson 2.2.
Slope-Intercept Form of a Line
Any non-vertical line can be written in the form
where m is the slope of the line and b is the y-intercept. This form of a linear equation is called the "slope-intercept" form of a line.
Changing Point-Slope Form to Slope-Intercept Form
In Lesson 2.1 you found two point-slope equations that represent the line through the points (-1, -2) and (2, 3). The equations were
Each equation can be changed into slope-intercept form by performing the indicated multiplication and combining the constant terms.
 and
and

Notice that both equations are transformed into the same slope-intercept equation. Even though the point-slope forms appear different, the slope-intercept forms are identical. If any point on this line is used to write a point-slope form for the equation, it will simplify to the same slope-intercept form.
Slope and y-Intercept Values
The slope and y-intercept values indicate characteristics of the relationship between the two variables x and y.
- The slope indicates the rate of change in y per unit change in x.
- The y-intercept indicates the y-value when the x-value is 0.
Recall that the line of best fit for the car values found in Lesson 2.2 was
where x represents the age of the car and y represents the car's value.
The slope of the line that best fits the car data is -1478 dollars per year and the y-intercept is 13,906 dollars.
2.3.1 What does the slope of the line of best fit tell you about the change in the value of this model of car? What does the y-intercept tell you about the value of the car? Click here for the answer.
The Units of Slope
The slope of a line is the change in y,
![]() y (read "delta y"), divided by the change in x,
y (read "delta y"), divided by the change in x,
![]() x (read "delta x"). That is, slope is
x (read "delta x"). That is, slope is
![]() , which is a rate of change. Stating the units for
, which is a rate of change. Stating the units for
![]() y and
y and
![]() x will help clarify what the slope tells you about how the y-value changes from one x-value to the next. In the previous example, stating the slope as
x will help clarify what the slope tells you about how the y-value changes from one x-value to the next. In the previous example, stating the slope as
![]() is more descriptive than just stating that the slope is
is more descriptive than just stating that the slope is
2.3.2 The linear equation that describes the value of an average home is y = 5632x + 14760, where x is years since 1970 and y is the value of an average house in dollars. What does the slope of this line tell you about the value of an average house in this area? What does the y- intercept tell you? Click here for the answer.
Value of a House as a Function of Size
The real estate section of a local newspaper listed the selling price along with the size in square feet for houses that are for sale in the area. The scatter plot for the data looked approximately linear and the linear regression equation for the data was found to be
where x is the size in square feet and y is the price of the house.
2.3.3 What does the slope of this line tell you about the homes listed in this area? What does the y-intercept tell you? Click here for the answer.
100-Meter Dash
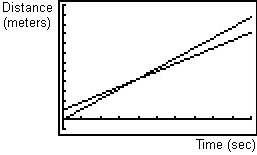
Carl and Ray compete in a 100-meter dash. Carl's distance from the starting line after the start of the race can be modeled by y = 10.7x, where x represents time in seconds and y is measured in meters. The corresponding equation for Ray is y = 8.1x + 10. Below are the graphs for the two runners in a [0, 10, 1] x [-10, 120, 10] Viewing window.

2.3.4 What do the slopes tell you about the two runners? What do the y-intercepts tell you about the start of the race? Who won? Click here for the answer.
The Line of Best Fit as an Approximation
The equation that is created when you perform linear regression is an equation for the linear model that produces the least amount of error between the actual output values (y-values) in the data set and the output values predicted by the model for those input values (x-values).
Because the line only approximates the data, many of the data points may not lie on the line and the model may imply erroneous conclusions. For example, the line that represents Ray's distance from the starting line indicates that he started the race 10 meters ahead of the starting line. It's quite possible that he started the race at the starting line but the model needed to have a y-intercept of 10 to attain the least error between the model and the actual data over the entire data set.