There are several ways to write an equation of a line. In this lesson you will use the point-slope form of a line to create a graph. You will investigate the relationship between perpendicular lines and adjust the calculator's Viewing Window so that the lines look perpendicular.
Slope
The slope of the line through the points (x1, y1) and (x2, y2) is given by
![]()
For example the slope of the line through the points (-1, -2) and (2, 3) is
Point-Slope Form of a Line
The point-slope form of the line with slope m that passes through a point (x1, y1) is
The line that passes through the points (-1, -2) and (2, 3) has slope
![]() and its equation can be written using either point for (x1,y1).
and its equation can be written using either point for (x1,y1).
or
Both equations represent the same line.
Graphing a Line
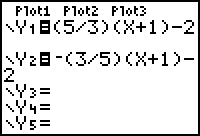
- Enter the expression (5/3)(X+1) - 2 in the Y= editor.
- Use the following window settings for the graph:
-
Display the graph in the Standard Viewing window by setting the window parameters and pressing
 or by pressing
 and selecting 6:ZStandard.
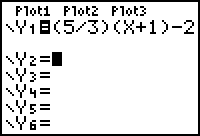
| Xmin = -10 | Ymin = -10 |
| Xmax = 10 | Ymax = 10 |
| Xscl = 1 | Yscl = 1 |
|
|||
|
|
|||
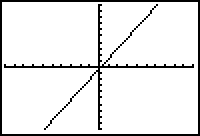
Viewing Window References
The following notation will be used to represent the window settings:
The first triplet of values represents Xmin, Xmax and Xscl and the second triplet of values represents the corresponding Y-parameters.
The TRACE Cursor
The TRACE cursor may be used to move the cursor from one plotted point to the next along a function's graph. The cursor's coordinates are displayed at the bottom of the screen and the cursor can be moved along the graph by using the left and right arrow keys. The function is displayed in the top-left corner of the screen.
-
Activate the TRACE cursor by pressing
 and then move the cursor along the line by pressing
 several times to move the cursor to the left of it's original position.
-
Press and hold
 to move the cursor continuously until the cursor is to the left of x = -1.
The cursor appears on the line, the cursor coordinates appear at the bottom of the screen, and the corresponding function appears at the top of the screen.
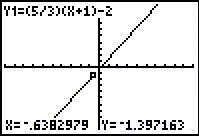
Notice the cursor cannot be placed directly on the point with x-coordinate x = -1 by using the left and right arrow keys.
Entering TRACE Values Directly
You may place the TRACE cursor at a specific point by directly entering the point's x-value.
-
Place the cursor directly on the point where x = -1 by pressing
.gif)

 .
.
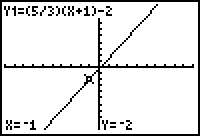
The y-value is -2 when the x-value is -1, as shown at the bottom of the screen. The point (-1, -2) is on the line.
2.1.1 Place the TRACE cursor directly on the point where x = 2 and determine the corresponding y-value. Click here for the answer.
The TRACE cursor shows that the line passes through the point (2, 3).
Slopes of Perpendicular Lines
If two non-vertical lines are perpendicular, then their slopes are negative reciprocals of each other. That is, if m is the slope of a line, then any line perpendicular to it will have slope
![]()
Finding Equations of Perpendicular Lines
Suppose you want an equation of the line passing through (-1, -2) that is perpendicular to the line
![]()
The slope of the desired perpendicular line is
![]() because the slope of the original line is
because the slope of the original line is
![]()
Using the point-slope form with
![]() and point (-1, -2), the point slope equation of the perpendicular line is
and point (-1, -2), the point slope equation of the perpendicular line is
![]()
Graphing Perpendicular Lines
- Enter the expression -(3/5)(X+1) - 2 in Y2 of the Y= editor.
-
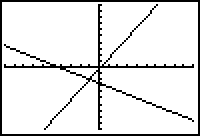
Display both graphs in a [-10, 10, 1] x [-10, 10, 1] Viewing window by pressing
 .
.
Using A Square Window
Notice the lines do not appear to be perpendicular in the window above because the units along the x-axis are larger than the units along the y-axis. The Viewing Window may be redefined by selecting ZSquare from the Zoom menu. Selecting a Zoom Square window makes units of equal length on both axes and will make the lines appear perpendicular.
-
Press
 and select 5:ZSquare.
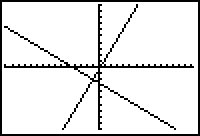
The Zoom menu's ZSquare feature adjusts the viewing window so that the lines appear perpendicular.
2.1.2 What are the Viewing Window values of the above Viewing Window? Click here for the answer.
|
|||
|
|
|||