|
Catalog > |
|
|
Returns the absolute value of the argument. Note: See also Absolute value template, here. If the argument is a complex number, returns the number’s modulus. |
|
|
Catalog > |
||||||||||
|
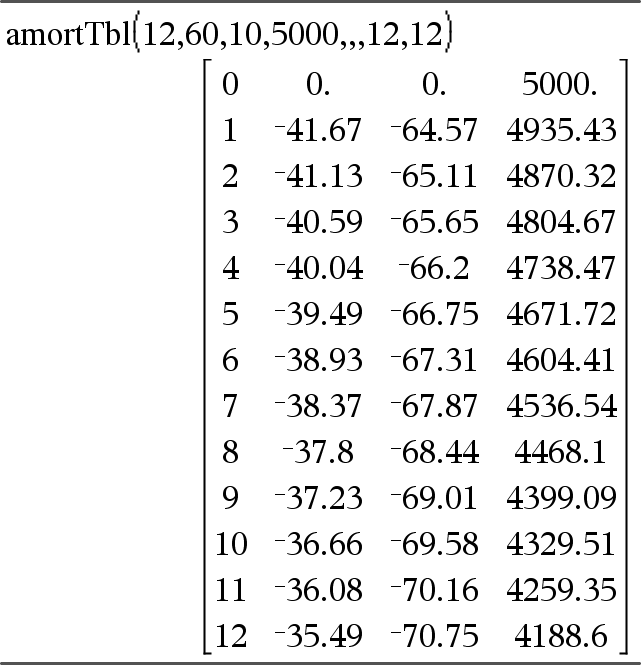
amortTbl(NPmt,N,I,PV, [Pmt], [FV], [PpY], [CpY], [PmtAt], [roundValue]) ⇒ matrix Amortization function that returns a matrix as an amortization table for a set of TVM arguments. NPmt is the number of payments to be included in the table. The table starts with the first payment. N, I, PV, Pmt, FV, PpY, CpY, and PmtAt are described in the table of TVM arguments, here.
roundValue specifies the number of decimal places for rounding. Default=2. The columns in the result matrix are in this order: Payment number, amount paid to interest, amount paid to principal, and balance. The balance displayed in row n is the balance after payment n. You can use the output matrix as input for the other amortization functions ΣInt() and ΣPrn(), here, and bal(), here. |
|
|
Catalog > |
|
|
angle(Value1) ⇒ value Returns the angle of the argument, interpreting the argument as a complex number. |
In Degree angle mode:
|
|
angle(List1) ⇒ list Returns a list or matrix of angles of the elements in List1 or Matrix1, interpreting each element as a complex number that represents a two-dimensional rectangular coordinate point. |
|
Catalog > |
|
|
ANOVA List1,List2[,List3,...,List20][,Flag] Performs a one-way analysis of variance for comparing the means of two to 20 populations. A summary of results is stored in the stat.results variable. (here) Flag=0 for Data, Flag=1 for Stats |
|
|
Output variable |
Description |
|
stat.F |
Value of the F statistic |
|
stat.PVal |
Smallest level of significance at which the null hypothesis can be rejected |
|
stat.df |
Degrees of freedom of the groups |
|
stat.SS |
Sum of squares of the groups |
|
stat.MS |
Mean squares for the groups |
|
stat.dfError |
Degrees of freedom of the errors |
|
stat.SSError |
Sum of squares of the errors |
|
stat.MSError |
Mean square for the errors |
|
stat.sp |
Pooled standard deviation |
|
stat.xbarlist |
Mean of the input of the lists |
|
stat.CLowerList |
95% confidence intervals for the mean of each input list |
|
stat.CUpperList |
95% confidence intervals for the mean of each input list |
|
Catalog > |
|
|
ANOVA2way List1,List2[,List3,…,List10][,levRow] Computes a two-way analysis of variance for comparing the means of two to 10 populations. A summary of results is stored in the stat.results variable. (See here.) LevRow=0 for Block LevRow=2,3,...,Len-1, for Two Factor, where Len=length(List1)=length(List2) = … = length(List10) and Len / LevRow Î {2,3,…} |
|
Outputs: Block Design
|
Output variable |
Description |
|
stat.F |
F statistic of the column factor |
|
stat.PVal |
Smallest level of significance at which the null hypothesis can be rejected |
|
stat.df |
Degrees of freedom of the column factor |
|
stat.SS |
Sum of squares of the column factor |
|
stat.MS |
Mean squares for column factor |
|
stat.FBlock |
F statistic for factor |
|
stat.PValBlock |
Least probability at which the null hypothesis can be rejected |
|
stat.dfBlock |
Degrees of freedom for factor |
|
stat.SSBlock |
Sum of squares for factor |
|
stat.MSBlock |
Mean squares for factor |
|
stat.dfError |
Degrees of freedom of the errors |
|
stat.SSError |
Sum of squares of the errors |
|
stat.MSError |
Mean squares for the errors |
|
stat.s |
Standard deviation of the error |
COLUMN FACTOR Outputs
|
Output variable |
Description |
|
stat.Fcol |
F statistic of the column factor |
|
stat.PValCol |
Probability value of the column factor |
|
stat.dfCol |
Degrees of freedom of the column factor |
|
stat.SSCol |
Sum of squares of the column factor |
|
stat.MSCol |
Mean squares for column factor |
ROW FACTOR Outputs
|
Output variable |
Description |
|
stat.FRow |
F statistic of the row factor |
|
stat.PValRow |
Probability value of the row factor |
|
stat.dfRow |
Degrees of freedom of the row factor |
|
stat.SSRow |
Sum of squares of the row factor |
|
stat.MSRow |
Mean squares for row factor |
INTERACTION Outputs
|
Output variable |
Description |
|
stat.FInteract |
F statistic of the interaction |
|
stat.PValInteract |
Probability value of the interaction |
|
stat.dfInteract |
Degrees of freedom of the interaction |
|
stat.SSInteract |
Sum of squares of the interaction |
|
stat.MSInteract |
Mean squares for interaction |
ERROR Outputs
|
Output variable |
Description |
|
stat.dfError |
Degrees of freedom of the errors |
|
stat.SSError |
Sum of squares of the errors |
|
stat.MSError |
Mean squares for the errors |
|
s |
Standard deviation of the error |
|
/v keys |
|
|
Ans ⇒ value Returns the result of the most recently evaluated expression. |
|
|
Catalog > |
|
|
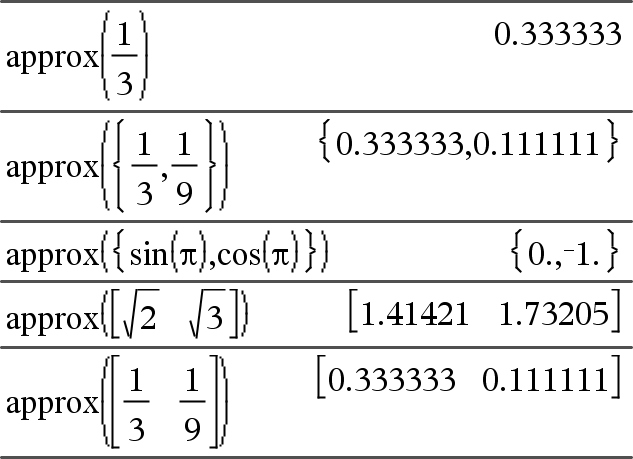
approx(Value1) ⇒ number Returns the evaluation of the argument as an expression containing decimal values, when possible, regardless of the current Auto or Approximate mode. This is equivalent to entering the argument and pressing /·. |
|
|
approx(List1) ⇒ list Returns a list or matrix where each element has been evaluated to a decimal value, when possible. |
|
|
Catalog > |
|
|
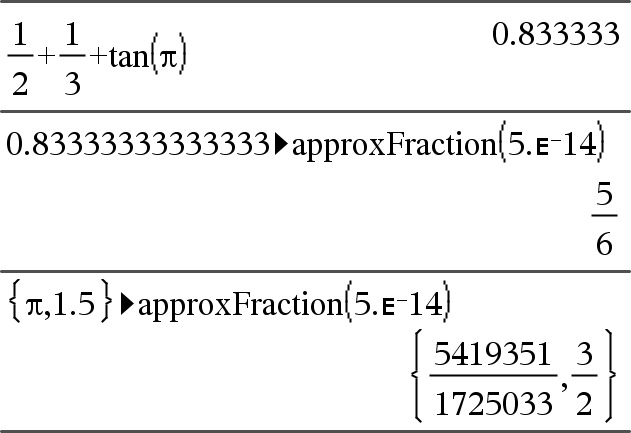
List►approxFraction([Tol]) ⇒ list Matrix►approxFraction([Tol]) ⇒ matrix Returns the input as a fraction, using a tolerance of Tol. If Tol is omitted, a tolerance of 5.E-14 is used. Note: You can insert this function from the computer keyboard by typing @>approxFraction(...). |
|
|
Catalog > |
|
|
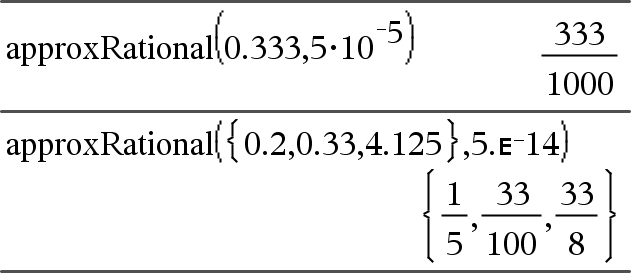
approxRational(Value[, Tol]) ⇒ value approxRational(List[, Tol]) ⇒ list approxRational(Matrix[, Tol]) ⇒ matrix Returns the argument as a fraction using a tolerance of Tol. If Tol is omitted, a tolerance of 5.E-14 is used. |
|
|
See cos-1(), here. |
|
|
|
|
|
See cosh-1(), here. |
|
|
|
|
|
See cot-1(), here. |
|
|
|
|
|
See coth-1(), here. |
|
|
|
|
|
See csc-1(), here. |
|
|
|
|
|
See csch-1(), here. |
|
|
|
|
|
See sec-1(), here. |
|
|
|
|
|
See sech-1(), here. |
|
|
|
|
|
See sin-1(), here. |
|
|
|
|
|
See sinh-1(), here. |
|
|
|
|
|
See tan-1(), here. |
|
|
|
|
|
See tanh-1(), here. |
|
|
|
|
|
Catalog > |
|
|
augment(List1, List2) ⇒ list Returns a new list that is List2 appended to the end of List1. |
|
|
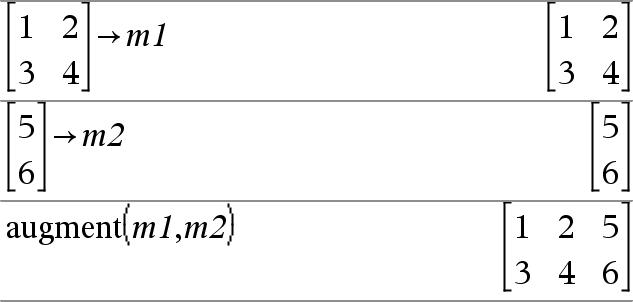
augment(Matrix1, Matrix2) ⇒ matrix Returns a new matrix that is Matrix2 appended to Matrix1. When the “,” character is used, the matrices must have equal row dimensions, and Matrix2 is appended to Matrix1 as new columns. Does not alter Matrix1 or Matrix2. |
|
|
Catalog > |
|
|
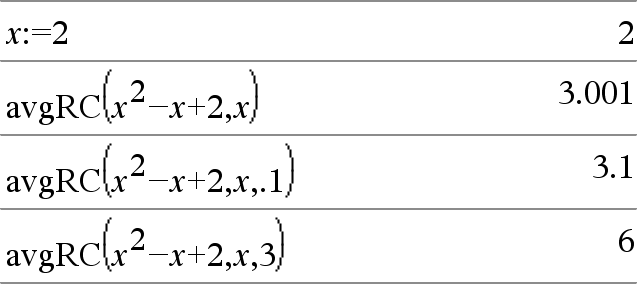
Returns the forward-difference quotient (average rate of change). Expr1 can be a user-defined function name (see When Value is specified, it overrides any prior variable assignment or any current “|” substitution for the variable. Step is the step value. If Step is omitted, it defaults to 0.001. Note that the similar function |
|


