This lesson investigates the procedure to find derivatives, such as
![]() and
and
![]() , for parametric equations x = f(t), y = g(t).
, for parametric equations x = f(t), y = g(t).
The Chain Rule
Suppose a curve is defined by the parametric equations
x = f(t)
y = g(t)
The Chain Rule states that the derivative
![]() on the parametric curve is the ratio of
on the parametric curve is the ratio of
![]() to
to
![]() . Higher derivatives are found in a similar fashion. Symbolically,
. Higher derivatives are found in a similar fashion. Symbolically,
![]()
Finding First and Second Derivatives
The procedure below will create two functions that return the values of
![]() and
and
![]() for parametric equations defined by x(t) and y(t). You can then define x(t) and y(t) and use the new functions to find these two derivatives for the resulting parametric curve.
for parametric equations defined by x(t) and y(t). You can then define x(t) and y(t) and use the new functions to find these two derivatives for the resulting parametric curve.
|
|||
|
|
|||
- Perform NewProb
- Define dydx(t) = d(y(t),t)/d(x(t),t)
- Define d2ydx2(t) = d(dydx(t),t)/d(x(t),t)
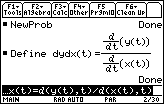
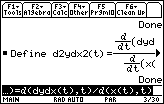
Use the new functions to find dy/dx and d2y/dx2 for the parametric equations
x(t) = sec t
y(t) = tan t
Define the parametric equations below. Recall that sec
![]()
- Define x(t)=1/cos(t)
- Define y(t)=tan(t)
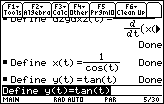
Find
![]() and
and
![]() by using the functions defined earlier.
by using the functions defined earlier.
- Enter dydx(t)
- Enter d2ydx2(t)
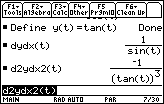
Finding Derivatives from a Graph
The slope of the tangent line at a point on the graph of a parametric curve can be found by using the "Derivative" feature of the Math menu on the Graph screen.
- Set xt1 = x(t)
- Set yt1 = y(t)
-
Set the Window values to [0, 2
 ] x [-3, 3] x [-5, 5] and let tstep = 0.1
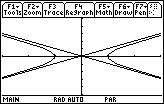
The graph is a hyperbola and the diagonal lines are not a part of the graph. The two diagonal lines are similar to the vertical lines that often appear in graphs of functions that have vertical asymptotes.
|
|||
|
|
|||
- Set tstep to 0.01 and redraw the graph in Dot graphing style.
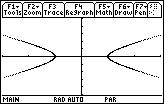
You can use the "Derivatives" feature in the F5:Math menu on the Graph screen to find the value of
![]() at t = 0.5.
at t = 0.5.
-
Open the Math menu by pressing

-
Open the "Derivatives" submenu by pressing

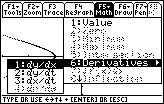
-
With "1:dy/dx" highlighted, press
 to activate this feature
-
Enter the value 0.5 and press

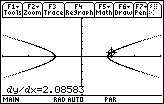
23.2.1 Find the value of
![]() at t = 0.5 by entering dydx(0.5) in the Edit Line of the Home screen and compare it to the value found using the "Derivative" feature of the Graph screen. Click here for the answer.
at t = 0.5 by entering dydx(0.5) in the Edit Line of the Home screen and compare it to the value found using the "Derivative" feature of the Graph screen. Click here for the answer.
Finding the Equation of the Tangent Line
-
Open the F5:Math menu on the Graph screen again by pressing

- Scroll down to highlight "A:Tangent".
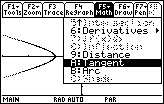
-
Select this feature by pressing

-
Enter 0.5 and press

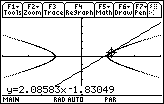
The tangent to the curve at the point when t = 0.5 is drawn and the equation of the tangent line is shown at the bottom of the screen.
23.2.2 Find the slope of the tangent line when t = 2 for the parametric equations
![]() .
.
|
|||
|
|
|||
Click here for the answer.
23.2.3 Display the curve
![]()
Click here for the answer.