In this lesson the graphs of parametric curves are explored. The window parameters of the Parametric graphing mode are discussed and inverse parametric relations are graphed.
Comparing Function and Parametric Graphing Modes
When graphing functions in Function mode on your TI-89 the independent variable is x and the dependent variable is y. Each value chosen for x produces a unique value for y and they indicate a point on the graph of the function.
When graphing equations in Parametric mode the independent variable is t and the dependent variables are x and y. In other words x and y are both functions of a common parameter t. Each value of t produces a unique point on the graph.
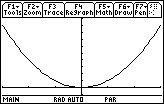
Graphing the function y = x2 in Function mode produces a parabola. The same curve can also be graphed in Parametric mode by using the equations below.
x = t
y = t 2
Creating Parametric Graphs
-
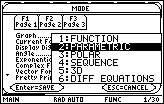
Open the Mode menu by pressing

- Highlight "2:PARAMETRIC" in the Graphs submenu
-
Select 2:PARAMETRIC by pressing

-
Save the mode settings and exit the Mode menu by pressing

-
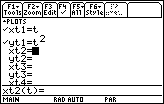
Open the Y= Editor by pressing


- Enter xt1=t and yt1=t^2
Entering the Window Parameters
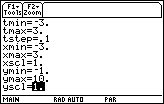
Parametric mode requires the beginning and ending values of the independent variable t, entered as tmin and tmax, and the amount of change between subsequent values of t, entered as tstep. The graph will be displayed in a window determined by the x and y parameters.
-
Open the Window Editor by pressing


- Enter the following values
-
Display the graph by pressing


Controlling the Graph's Appearance
In Parametric mode you have more control over the appearance of the graph than in Function mode.
23.1.1 What will happen to the graph if you let tmin = 0 in the Window Editor? Sketch your prediction then make the change on your TI-89 and display the graph with the new value of tmin. Click here for the answer.
Reset the Window values to
| tmin = -3 | xmin = -3 | ymin = -3 |
| tmax = 3 | xmax = 3 | ymax = 3 |
| tstep = 0.1 | xscl = 1 | yscl = 1 |
Exchanging x and y
23.1.2 Describe what will happen to the graph if you swap xt1 and yt1. Sketch your prediction then set
xt1 = t^2
yt1 = t
and display the graph to verify your prediction. Click here for the answer.
Graphing Curves That Are Not Functions
Any function y = f(x) can be graphed in Parametric mode by letting x = t and y = f(t). However, curves that are not functions can also be graphed in Parametric mode.
23.1.3 For 0
![]() t
t
![]() 2
2
![]() predict the curve that is produced by the parametric equations
predict the curve that is produced by the parametric equations
x = cos t
y = sin t
Create the graph of the parametric equations to verify your prediction. Click here for the answer.
Graphing Other Parametric Curves
Parametric equations often represent interesting graphs that cannot be graphed using the Function mode.
Display the graph of the parametric equations
x = 6sin t – sin 6t
y = 6cos t – cos 6t
in a [0, 2
![]() ] x [-10, 10] x [-10, 10] window. Set tstep = 0.1.
] x [-10, 10] x [-10, 10] window. Set tstep = 0.1.
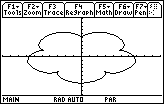
This graph is called an epicycloid and it has 5 "petals."
23.1.4 Change each 6 in the parametric equations to a 7 and graph the new equations. Then change the 7's to 8's and graph the equations. Describe the effect that the number N has on the graph of the epicycloid given below. Hint: notice the number of petals in each graph.
x = N sin t – sin Nt
y = N cos t – cos Nt
Click here for the answer.