In this lesson Euler's method is used to approximate a numerical solution to an initial-value problem. The method is based on linear approximations and uses a variation of the point-slope form of a linear equation: y1 = y0 + m(x1 – x0).
Getting Linear Approximations
Suppose we want to solve a differential equation of the form dy / dx = m(x, y). In general, this means that the slope of the solution y = f(x) at any point (x, y) may depend on both x and y. We are going to approximate the values of the solution at a sequence of x-values given by x1, x2, x3, ..., etc. Given an initial value y0 = f(x0), the value of y1 = f(x1) can be estimated by the linear approximation.
f(x1)
![]() f(x0) + m(x0, y0) · (x1 – x0)
f(x0) + m(x0, y0) · (x1 – x0)
Then the value of y2 = f(x2) can be approximated from the value of y1 = f(x1).
f(x2)
![]() f(x1) + m(x1, y1) · (x2 – x1)
f(x1) + m(x1, y1) · (x2 – x1)
After approximating f(x2) the same method can be used to approximate f(x3).
f(x3)
![]() f(x2) + m(x2, y2) · (x3 – x2)
f(x2) + m(x2, y2) · (x3 – x2)
Euler's method states that f(xn+1) can be approximated by using previously found values.
f(xn+1)
![]() f(xn) + m(xn, yn) · (xn+1 – xn)
f(xn) + m(xn, yn) · (xn+1 – xn)
|
|||
|
|
|||
Using Euler's Method
In Lesson 20.1 you solved the logistic initial-value problem
y' = 0.037 * y * (25 – y) and y(1) = 1
Use Euler's method to approximate the values of the solution to this differential equation. Let x0 = 1, y0 = 1, and x1 = 1.1. We compute m(x0, y0) = m(1, 1) using the differential equation with y replaced by y0 = 1.
m(x0, y0) = m(1, 1) = 0.037 * 1 * (25-1)
Note that x1 - x0 = 0.1, so
y1 = f(x1) = f(1.1)
![]() f(x0) + m(x0, y0) · (x1 - x0)
f(x0) + m(x0, y0) · (x1 - x0)
= 1 + 0.037 * 1 * (25-1) * 0.1.
- Perform NewProb
- Enter 1 + 0.037*1*(25 - 1)*0.1
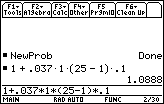
Let x2 = 1.3, x3 = 1.2, etc. Next we approximate y2 = f(1.2) using the approximate value found for y1 as the value of m(x1, y1).
y(1.2)
![]() 1.0888 + 0.037 · 1.0888 · (25 – 1.0888) · 0.1
1.0888 + 0.037 · 1.0888 · (25 – 1.0888) · 0.1
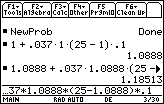
Then continue the process to find y3, y4, etc.
Using a Short Cut
There is a short cut that will speed up the process for subsequent approximations. The result of the most recent calculation is stored in a variable called "ans(1)". This can be entered into the Edit Line by pressing
![]()
![]() .
.
![]() is above
is above
![]() . This approach will also improve the accuracy somewhat, since it uses all 14 places, rather than the 6 we entered by hand.
. This approach will also improve the accuracy somewhat, since it uses all 14 places, rather than the 6 we entered by hand.
Because the most recent result represents y(1.2), the approximation for y(1.3) can be found by evaluating
y(1.3)
![]() ans(1) + 0.037 · ans(1) · (25 – ans(1))· 0.1
ans(1) + 0.037 · ans(1) · (25 – ans(1))· 0.1
- Enter the right-hand side of the expression
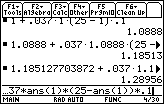
Because ans(1) has now been updated to 1.28956, you can simply press
![]() to approximate
to approximate
y(1.4).
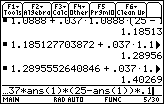
-
Approximate y(1.5) by pressing
 again
again
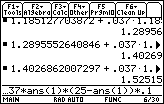
20.2.1 Approximate y(2) by pressing
![]() five more times.
five more times.
Click here for the answer.
|
|||
|
|
|||
Using Euler's Method in Differential Equation Graphing Mode
Euler's method can be used in Differential Equation graphing mode.
- Return to Differential Equation graphing mode
- Open the Y= Editor
-
Open the GRAPH FORMATS dialog box by pressing
 and selecting 9:Format
- Move the cursor down to the line labeled "Solution Method"
The differential equation y' = 0.037.y.(25 – y) with y(1) = 1 should be there.
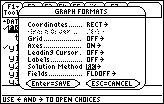
-
Highlight "Euler" by pressing


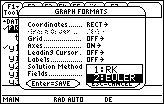
-
Select "Euler" for the solution method by pressing

-
Save this selection and exit the GRAPH FORMATS dialog by pressing

-
Turn on the scatter plot of the data given in Lesson 20.1 and display the new curve by pressing

 . Check the WINDOW settings to be sure that tstep = 0.1 and Estep (Euler step) = 1.
-
Select the Trace feature by pressing

-
Select the curve by pressing

A small "1" should appear in the upper right corner of the screen.
|
|||
|
|
|||
-
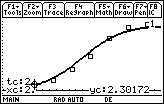
Display the coordinates of the points on the curve by repeatedly pressing

You should see the same values for y that you calculated with Euler's method.
-
Continue to press
 until the x-coordinate is 2
The same value found for y(2) using Euler's method in 20.2.1 is shown as the y-coordinate.
Displaying a Table of Values
You can see the Euler method values in a table.
-
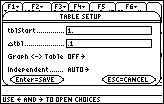
Open the Table Setup dialog box by pressing


-
Type 1 for tblStart and 0.1 for
 tbl
tbl
-
Save these values by pressing
 twice
twice
-
Display the table by pressing
 [TABLE]
-
Scroll down the table by pressing

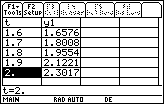
The values shown in the y1 column are found by using Euler's method, which should give you a better understanding of how the TI-89 Differential Equation graphing mode approximates the graph of the solution to an initial-value problem. The calculator computes approximate solution values for very small t-value iterations and displays short line segments that approximate the curve of the solution.
|
|||
|
|
|||