In this lesson you will modify a piecewise function to make it continuous and then define the function using the with( command.
Suppose the function f(x) is defined by

6.3.1 By using the definition of continuity, find the value of k that makes the function continuous at
Graphing a Piecewise Function
Display the graph of y = f(x) using the value of k that makes the function continuous. Be sure
-
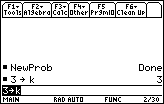
Return to the Home Screen and select New Problem by pressing


- Store the value found in Question 6.3.1 in k
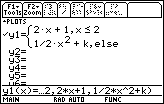
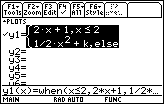
In the Y= Editor, define y1 as the piecewise function

-
Set y1=when(x
 2,2x+1,1/2*x^2+k)
Enter the
 symbol by pressing

 .
.
- Graph the function in a [-3, 7] x [-3, 25] window with xscl = 1 and yscl = 5
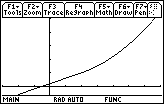
The graph appears to be continuous at x = 2.
6.3.2 How would the graph change if you changed k to 7? Click here for the answer.
Visualize the result of changing the value of k to 7.
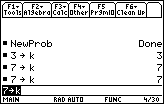
- Change the value of k to 7 on the Home Screen
Change the graphing style of y1 from Line to Dot so that the calculator will not connect the two pieces.
- Return to the Y= Editor and highlight y1 by using the cursor movement keys
-
While y1 is highlighted, display the Style menu by pressing


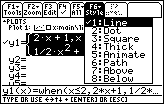
- Select "2:Dot"
- Display the graph of the function
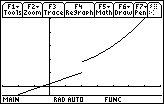
The parabolic part has been shifted upward, and the function is no longer continuous at x = 2. The discontinuity in this modified function (k = 7) is a jump discontinuity.
6.3.3 Evaluate the left- and right-hand limits of the piecewise function with k = 7. Click here for the answer.