The discontinuity you investigated in Lesson 6.1 is called a removable discontinuity because the discontinuity can be removed by redefining the function in order to fill a hole in the graph. In this lesson you will examine three other types of discontinuities: jump, oscillating and infinite.
Jump discontinuity
The function
![]() has a jump discontinuity at x = 0. Graphing can illustrate the reason for the name of this type of discontinuity. Be sure to set xres = 1.
has a jump discontinuity at x = 0. Graphing can illustrate the reason for the name of this type of discontinuity. Be sure to set xres = 1.
- Enter the expression y1=abs(x)/x in the Y= Editor
The "abs(" function can be pasted from the catalog by pressing
![]()
![]()
![]() .
.
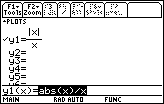
- Graph the function in a Zoom Decimal window, which is the fourth option in the Zoom menu
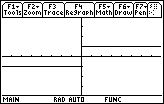
The function is not continuous at x = 0 because x = 0 is not in the domain of the function. The function is said to have a jump discontinuity because it jumps from y = -1 to y = 1 at x = 0. The left- and right-hand limits are defined as x approaches 0, but
![]() is undefined because
is undefined because
![]() . For a jump discontinuity, the one-sided limits are unequal.
. For a jump discontinuity, the one-sided limits are unequal.
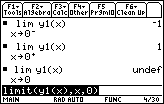
Because
![]() is in the Y= Editor, y1 may be used in place of the expression
is in the Y= Editor, y1 may be used in place of the expression
![]() in the limit function.
in the limit function.
y1(x) can be typed directly into the Edit Line by pressing
![]()
![]()
![]()
![]()
![]() .
.
Oscillating discontinuity
The function
![]() has a discontinuity at x = 0 because it is not defined at x = 0. It also has an oscillating discontinuity at x = 0. A few graphs will illustrate this.
has a discontinuity at x = 0 because it is not defined at x = 0. It also has an oscillating discontinuity at x = 0. A few graphs will illustrate this.
-
Graph
 in a [-2, 2] x [-2, 2] window
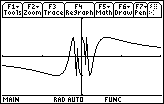
It is hard to tell what is happening near x = 0. You can use a feature in the Zoom menu called ZoomBox to magnify a portion of the graph near x = 0.
-
Display the Zoom menu by pressing

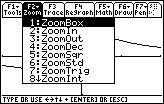
-
Select the Zoom Box feature by pressing

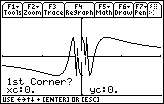
This feature will allow you to draw a box around the part of the graph you would like to magnify.
When the TI-89 prompts you for the first corner of the box,
- Move the cursor to the upper left corner of the desired box by using the cursor movement keys
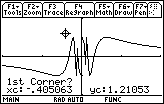
-
Mark the upper left corner by pressing

The cursor changes shape and the calculator prompts you for the second corner of the box, which should be diagonally opposite the first corner.
- Move the cursor to the opposite corner by using the cursor movement keys
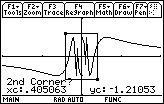
You should see the outline of a box evolve as you move the cursor.
-
Finish marking the box by pressing

The area inside the box is magnified to fill the entire viewing screen.
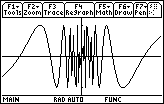
The Zoom Box feature magnifies the graph by adjusting the Window values to match the box corner coordinates.
This window shows even more oscillations than the previous one. No matter how many times you zoom in around the y-axis, the graph will continue to oscillate wildly. In fact, there are infinitely many oscillations packed near the y-axis. That is why
![]() is said to have an oscillating discontinuity at x = 0. Notice that the left- and right-hand limits do not exist in this case.
is said to have an oscillating discontinuity at x = 0. Notice that the left- and right-hand limits do not exist in this case.
|
|||
|
|
|||
Infinite discontinuity
The function y = tan(x) has an infinite discontinuity at
![]() .
.
-
Graph y = tan(x) in a [-2
 , 2
, 2
 ] x [-4, 4] window
- Set xscl and yscl to 1
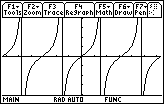
6.2.1 Based on the graph, why do you think y = tan(x) is said to have an infinite discontinuity at
![]() ? Evaluate the left- and right-hand limits at
? Evaluate the left- and right-hand limits at
![]() . Click here for the answer.
. Click here for the answer.