In this lesson you will explore continuity at a point, investigate discontinuity at a point, display discontinuities and learn how to redefine a function to remove a point discontinuity. You will then use the "when" function to graph piecewise defined functions.
Informally, a function is said to be continuous on an interval if you can sketch its graph on the interval without lifting your pencil off the paper. The formal definition of continuity starts by defining continuity at a point and then extends to continuity on an interval. This formal definition may not seem to have much in common with the concept of sketching a graph without lifting your pencil off the paper, but after investigating several examples with your TI-89, the connection between the formal and informal definitions may be more apparent.
Continuity at a Point
The formal definition says that a function f(x) is continuous at a point where x = c if
-
 exists
- f(c) exists (that is, c is in the domain of f)
-

A function is continuous on an interval if it is continuous at every point in the interval.
The definition of continuity can be used to show that
![]() is continuous at x =
is continuous at x =
![]() .
.
From the Home Screen,
-
Define

-
Evaluate
 and f(
 )
)
 is a yellow feature above the
 key.
key.
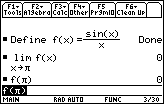
Because
![]() ,
,
![]() is continuous at x =
is continuous at x =
![]() .
.
Discontinuity at a Point
If any of the three conditions in the definition of continuity fails at x = k, the function is discontinuous at that point.
6.1.1 Is
![]() continuous at x = 0? Justify your answer.
continuous at x = 0? Justify your answer.
Click here for the answer.
Displaying Discontinuities
You can visualize a discontinuity at a point by graphing the function in an appropriate window.
The function f(x) is already defined as
![]() .
.
- Graph f(x) in a window that includes x = 0
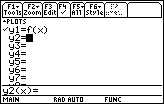
The y-axis will need to be turned off in order to see the discontinuity at x = 0.
-
While in the Y= Editor, open the Tools menu by pressing

- Highlight "9:Format" by using the cursor movement keys
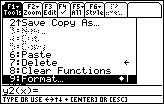
-
Open the Graph Formats screen by pressing

- Display the "Axes" settings by using the cursor movement keys
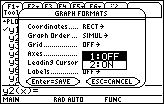
- Select "OFF"
-
Save the new Axes setting by pressing

-
Exit the Graph Formats screen by pressing

-
Graph the function in a [-6, 6] x [-2, 2] window with xres = 1.
You will not see the hole if you leave xres at the default value 2. Explore with Trace to see that f is not defined at x = 0.
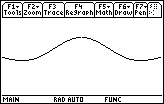
The discontinuity is represented as a hole whose coordinates are (0,1).
|
|||
|
|
|||
Removing the Discontinuity
The following shows how
![]() can be redefined so that it is continuous at x = 0.
can be redefined so that it is continuous at x = 0.
Using the When Function
The "when" function on the TI-89 can be used to redefine f(x) to be
![]() for x
for x
![]() 0 and 1 for x = 0. That is,
0 and 1 for x = 0. That is,
 .
.
To redefine f(x),
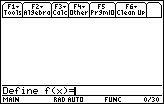
- Enter Define f(x)= to the Edit Line
-
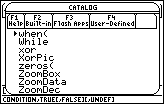
Select the "when(" function from the catalog by pressing

 to open the catalog and jump to the commands that begin with "w"
-
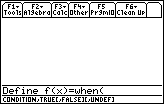
Paste the function to the Edit Line by pressing

|
|||
|
|
|||
-
Enter the condition x
 0
0
The
![]() symbol is in the MATH Test submenu, which is found by pressing
symbol is in the MATH Test submenu, which is found by pressing
![]()
![]()
![]() . (
. (
![]() is above
is above
![]() .) A shortcut for
.) A shortcut for
![]() is
is
![]()
![]() .
.
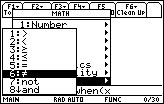
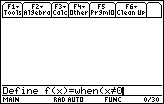
-
Enter a comma and the trueResult, sin(x)/x, and the falseResult, 1, separated by a comma and close the command with a parenthesis.
Press
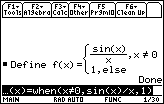
-
Graph the redefined f(x) in the same window as before with xres = 1.
Explore with Trace to see that f(0) = 1.
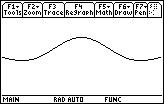
The point of discontinuity has been removed, or in other words, the hole has been filled. Therefore, this redefined f(x) is continuous at x = 0.
Resetting the Axes
Before leaving this lesson you should turn the graphing axes back on.
-
Return to the GRAPH Format menu by pressing


-
Display the Axes options by pressing


-
Highlight "ON" and press
 twice
twice